 Spectrum App
The Spectrum Application provides Wi-Fi analysis that measures radio frequency traffic to display data about signal strength, utilization, and noise in your environments.
The App features three graph types:
Frequency Spectrum view displays a heat map across the frequency band.
Waterfall view shows band and channel signal and utilization change over time.
Real Time view illustrates current, average, and max-hold signal levels.
NOTE: The Spectrum application requires the NXT-1000 or NXT-2000 Portable Spectrum Analyzer, sold separately or included in tester kits.
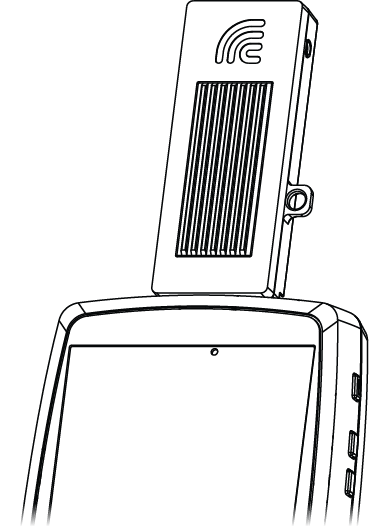
The NXT-2000 (shown below) replaces the NXT-1000 dual-band analyzer. NXT-2000 introduces tri-band Wi-Fi analysis for 2.4, 5, and 6 GHz.
The portable analyzers plug into the top USB port of your test unit.
Contact NetAlly if you need to acquire an NXT-2000 Portable Spectrum Analyzer.
Topics