Wi-Fi Details Screens
Each Details screen shows additional information about the selected item, any Problems detected by the CS Air, and counts for other connected network devices or IDs.
Tap any card on a Wi-Fi list screen (SSIDs, APs, BSSIDs, Clients, etc.) to open the Details screen for that device or network ID.
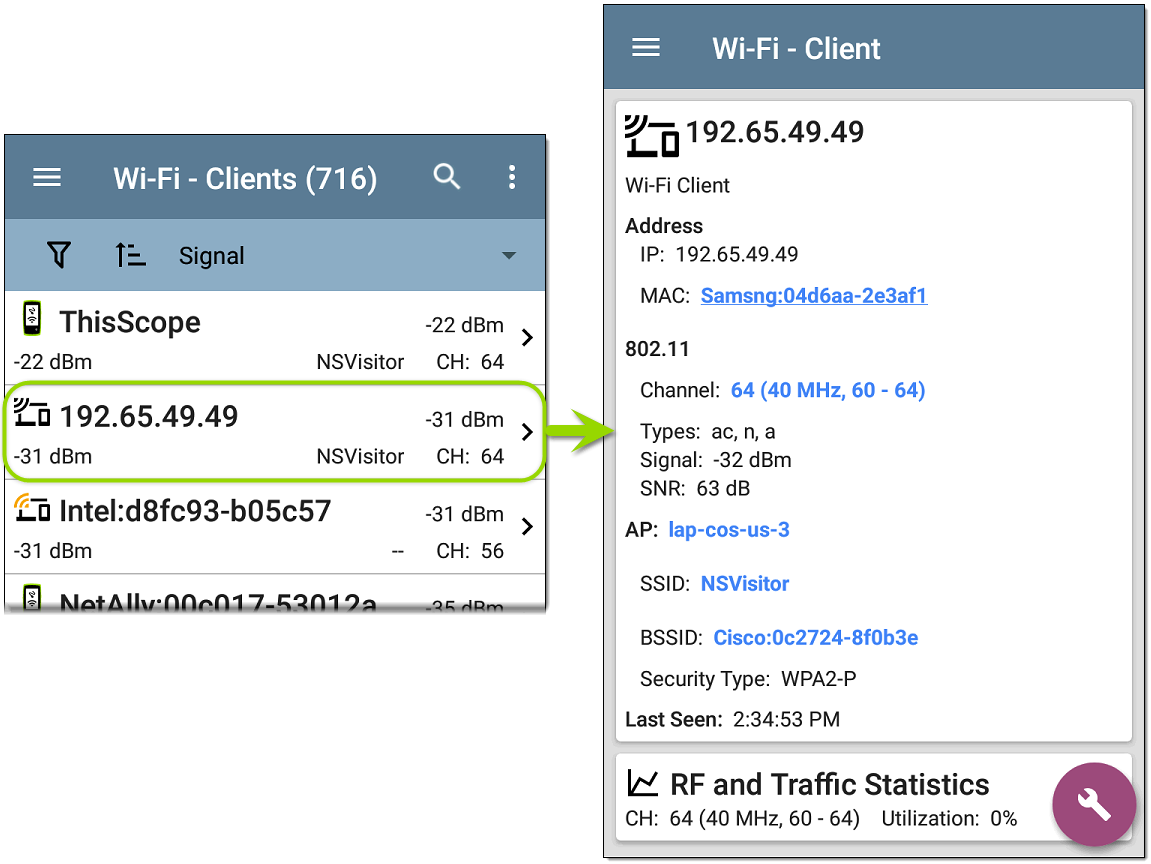
On the Wi-Fi Details screens, you can tap any blue linked name or address to open a Discovery or Wi-Fi app screen for the linked device.
In this Topic
RF and Traffic Statistics Overview
See also Data Fields on the Top Details Card in the Discovery chapter. Many of the Discovery data fields are the same as those shown in Wi-Fi Details.
Channel Details
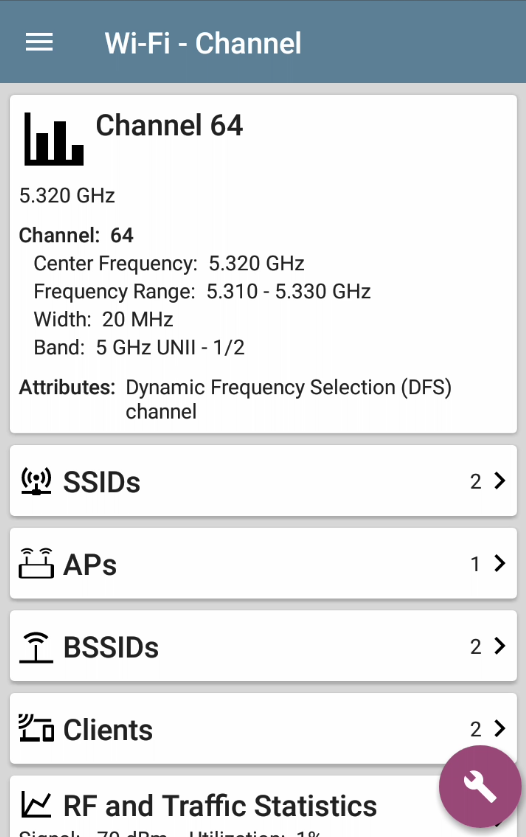
The Channel Details screen above shows how many SSIDs, APs, BSSIDs, and Clients are detected on Channel 64. Tap the lower cards in Wi-Fi Details to open a list screen that is filtered for the network component you are examining.
If you select BSSIDs on the Details screen for Channel 64, the BSSIDs screen opens and filters for BSSIDs found on Channel 64 only.
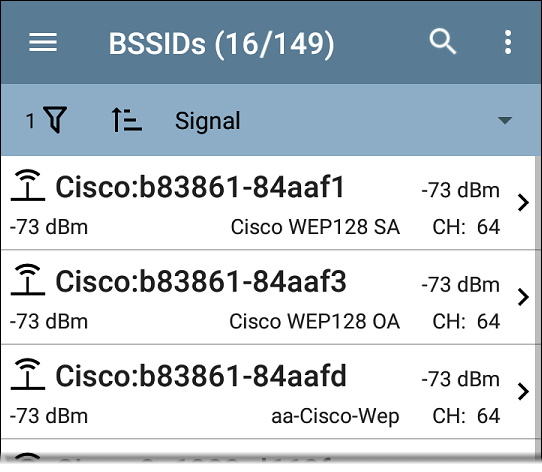
See the topics for each Wi-Fi app screen type (SSIDs, APs, etc.) for more discussion of the corresponding Details screen.
Wi-Fi Problems Screen
If any of the enabled Wi-Fi Problems are detected, the Problems card appears on the Wi-Fi Details screen.
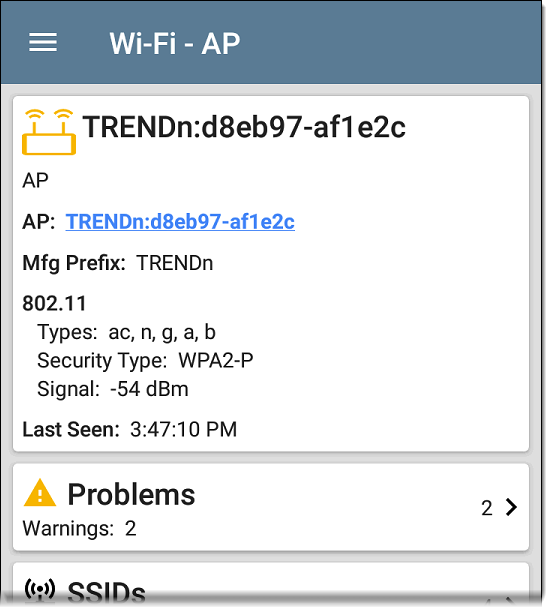
The Problems card shows the icon color of the highest severity problem, and the number of detected Warning, Failure, Information, and Resolved conditions for the device or network component.
Tap the card to open the Problems screen.
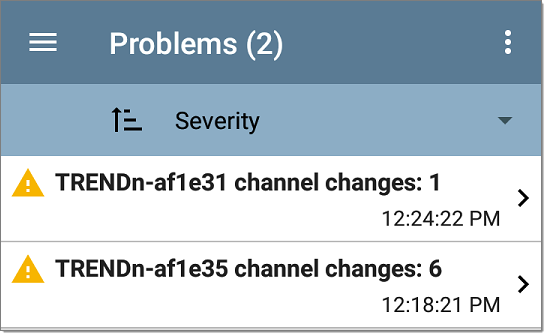
On the Problems list screen, tap the Problem's row to read a detailed description.
You can also tap the sort field to sort the list by Severity or by the time when the problem was First Detected. To clear a problem, tap the action overflow button  at the top right, and then tap Clear Problem.
See Problem Settings in the Discovery app to select which Wi-Fi Problems are detected and displayed by your CS Air.
RF and Traffic Statistics Overview
The Channel, BSSID, and Client Details screens can display RF and Traffic Statistics if any traffic is detected.
This section describes the common elements of the RF and Traffic Statistics screen. See the topic for each type of Details screen for differences.

The RF and Traffic Statistics card shows the Channel number or the Signal strength of the strongest AP on the channel and the channel's Utilization percentage.
Tap the card to view graphs of Signal, Noise, Utilization, and Retries.
To pan and zoom on the graphs, you can swipe, double tap, and move the slider. See the Trending Graphs topic for an overview of the graph controls.
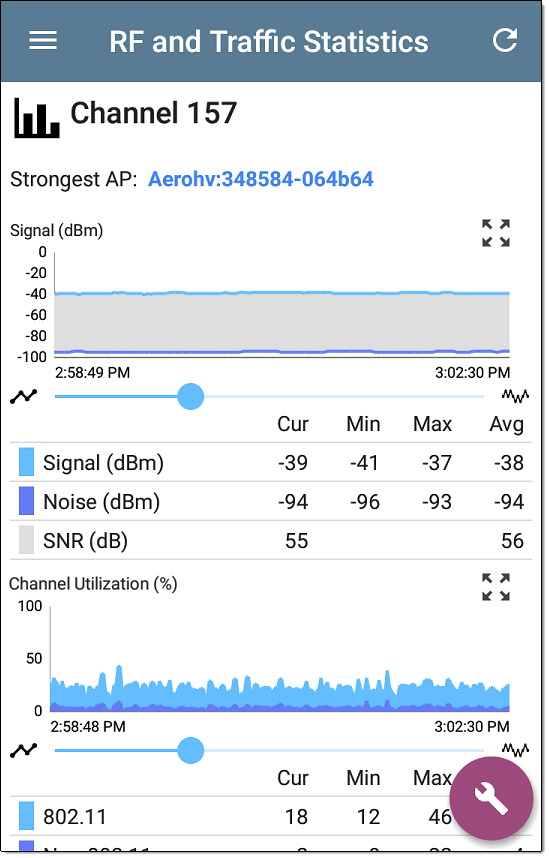
Strongest AP: The AP on the channel with the strongest signal
Under each graph, a legend table displays the Current, Minimum, Maximum, and Average measurements. The Current column contains measurements from the last second. Min, Max, and Avg columns show cumulative measurements gathered during the time the RF and Traffic screen has been open.
Tap the refresh button  at the top of the screen to clear and restart the measurements.
Signal (dBm) graph: Plots the signal strength in dBm of the selected AP or AP with the strongest signal on a channel
- Signal - The AP's signal strength in dBm
- Noise - The noise level in dBm on the channel used
- SNR - The network's signal-to-noise ratio, a measure of signal strength relative to noise, measured in decibels (dB)
Channel Utilization (%) graph: Plots percentage of the channel capacity being used by 802.11 devices and by non-802.11 interference.
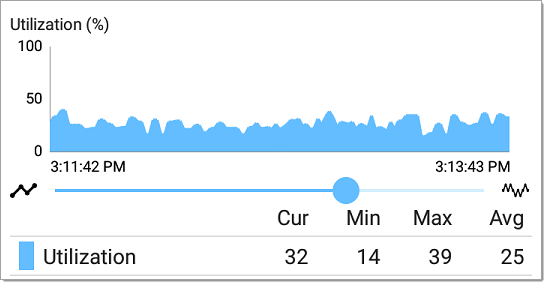
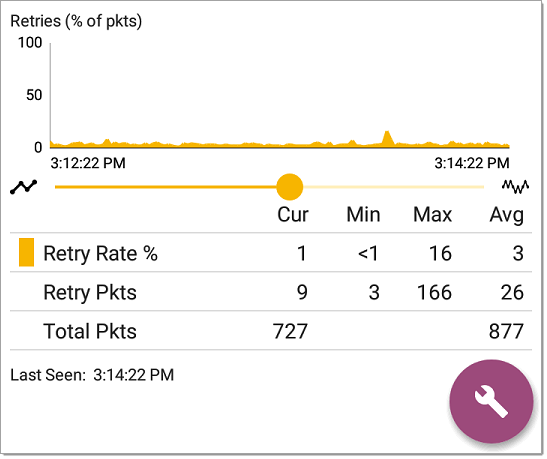
Retries (% of packets) graph: Plots percentage of transmitted packets that are retry packets.
-
Retry Rate % - The percentage of total packets that are retry packets
-
Retry Pkts - The number of retry packets
-
Total Pkts - The total number of transmitted packets