Link-Live Release Notes v9.1
These Link-Live Release Notes briefly describe the new features and enhancements included in the release.
NOTE: Certain features and enhancements are only available for specific AllyWare testers. See sub-headings. Many advanced Link-Live analysis features are only available to active AllyCare customers.
Version 9.1 New Features & Enhancements
AirMapper Refactor: Extensive Performance and UI Updates
With AllyWare Testers: EtherScope nXG, AirCheck G3, CyberScope, CyberScope Air, and AirMagnet Survey software
The latest release of Link-Live delivers faster survey performance and report processing, smoother navigation, new views for analyzing your data, and greater responsiveness throughout the AirMapper experience.
NOTE: Surveys created prior to the v9.1 update will need to be reprocessed with the new software. Click Unarchive to reprocess your previous AirMapper surveys.
Processing and Performance
-
Faster! Surveys load more quickly, and reports generate in less time.
-
Responsive maps: New pan and zoom actions, resizable data tables, and customizable heatmap color legends support user-controlled min/max values for clearer visualization.
-
Polished navigation: Updated animations and menu behaviors make moving through the interface more intuitive.
-
Simplified workflows: Streamlined View and Template options reduce steps for creating, managing, and reusing heatmap and InSites configurations.
-
Expanded data support: Active survey results are now included in the unified heatmap view, making it easier to review performance alongside Passive and other survey data.
Unified Survey Map View
View and manage the heatmap with updated menus and a new, unified map screen, where users can filter for Active/Passive, 1x1, Client, and Bluetooth data.
-
One view for all modes: Passive, Active, 1x1 Active, Clients, Probing Clients, and Bluetooth survey results are now displayed together, with selection buttons across the top of the map.
-
Persistent filters: Any filters you apply stay active as you switch between modes. Easily switch between modes to contrast coverage, performance, and device visibility.
-
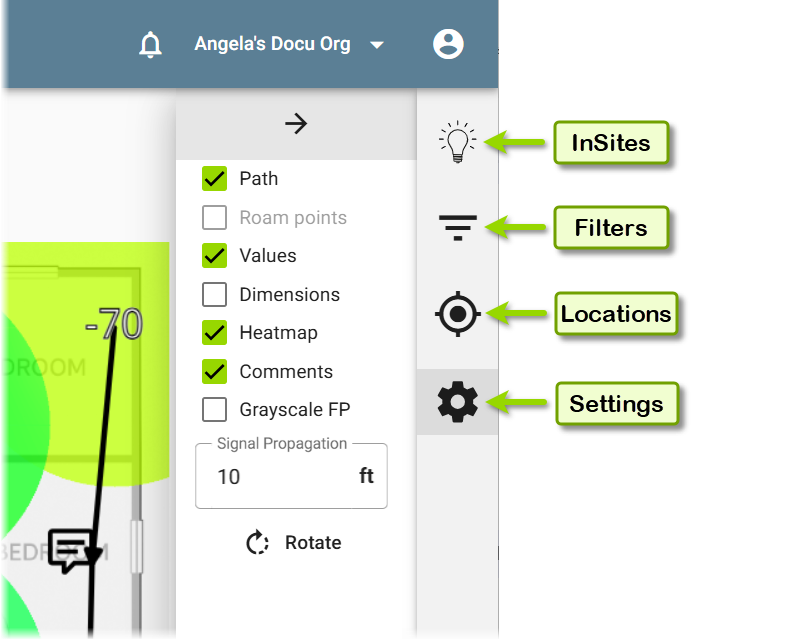
Consolidated controls: A new right-side menu provides access to InSites, Filters, Locations, and Settings from one place.
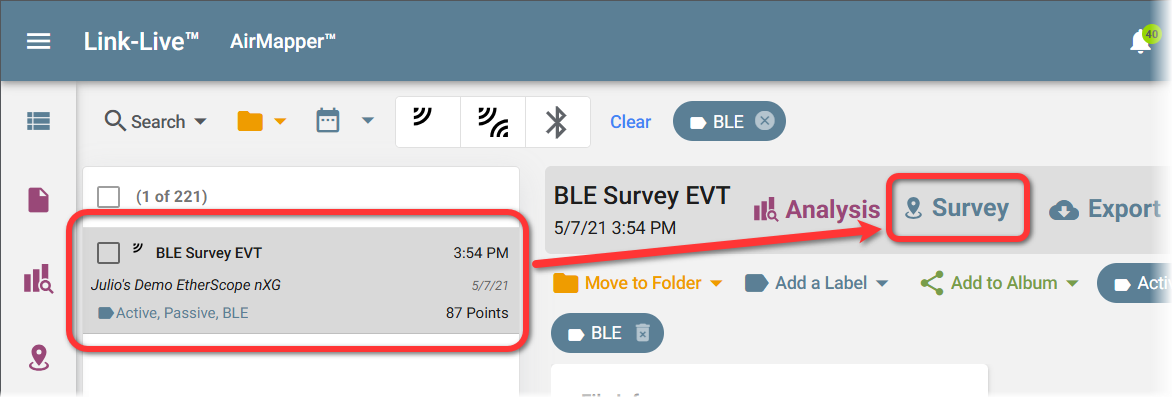
To open the unified Survey view, select a file on the AirMapper screen and click (or tap) the Survey button.
Two New Navigation Menus
Use the new mode buttons (shown below) across the top left of the map to select and switch between data modes.
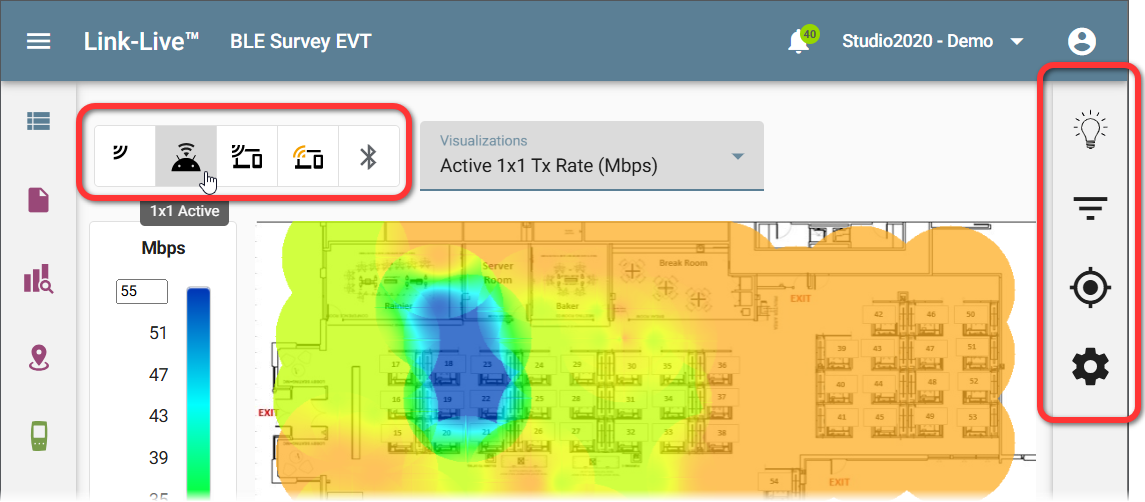
The Survey file shown above is a Passive survey; it contains data for Passive scan, 1x1 Active measurements, Clients, Probing Clients, and Bluetooth, which can be selected using the buttons in the top left horizontal menu on the Survey screen.
Another new menu that slides out from the right side of the screen consolidates access to InSites, Filters, Locations, and Settings for the current survey.
Use these controls to further refine and analyze your survey data.
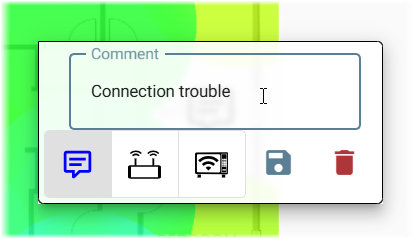
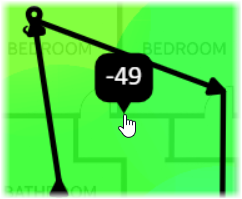
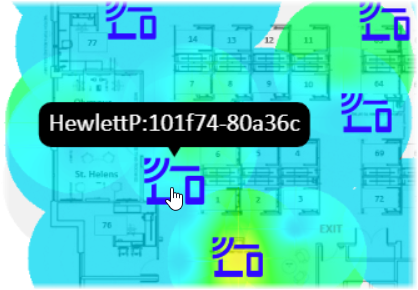
New Map Commenting Icons
AP and interferer icons have been added for heatmap comments, giving users additional options for notating a survey.
Press Ctrl + click a spot on the map to add a comment. Users can create, edit, and delete these comments from the heatmap.
Enhanced Pan and Zoom
You can now pan and zoom on the Survey map. Hover your cursor over the map to display the hand tool.
-
Pan: Click and drag to move across the floorplan.
-
Zoom: Use the scroll wheel to zoom in and out with greater precision.
-
Full Data access: Click any survey point to view its details in the table below the map.
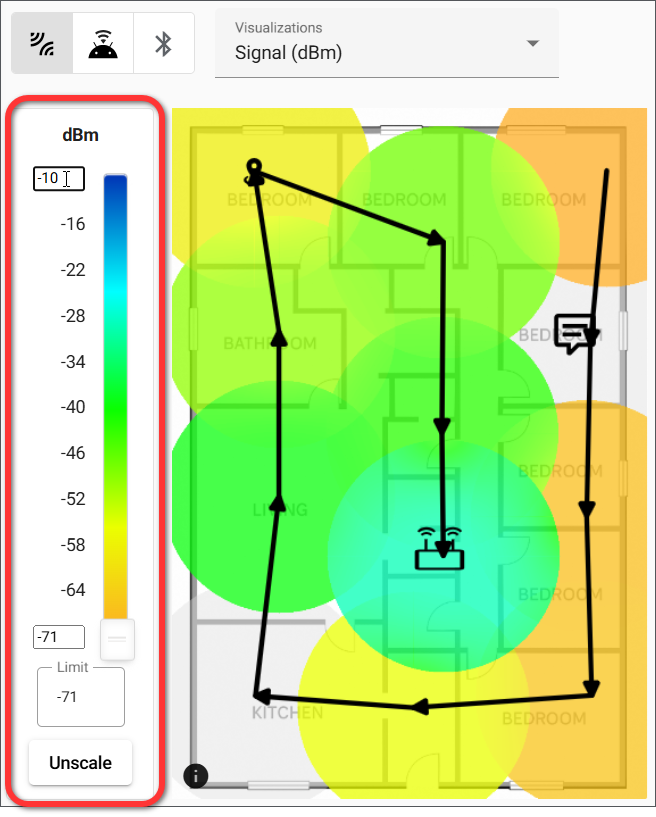
Editable Color Legends Limits
You can now edit the minimum and maximum values on the Survey map color legend and enter custom ranges to adjust the heatmap display. These values change the color gradient to fit within the new limits, making heatmaps more colorful and easier to review.
-
Set custom ranges: Enter minimum and maximum values to adjust the color gradient.
-
Click AutoScale to automatically adjust the legend limits so the color gradient shows the full range of values with maximum contrast.
-
Click Unscale to reset the legend to its default settings.
Informational Banners
New and updated information banners alert users to Survey archive status and the tester unit’s AllyCare status.
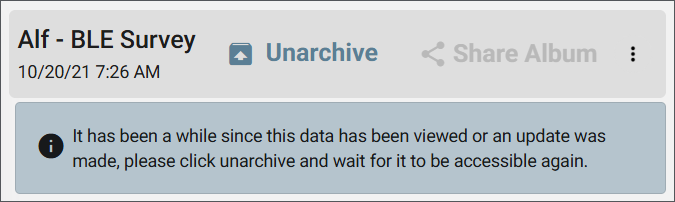
AirMapper Survey projects are auto-archived after 30 days of not being viewed or when Link-Live receives a software update. Click Unarchive to make your survey data available again.
Survey Data
-
Passive surveys: Results now include simulated 1x1 Active Locations plus AP, Client, Probing Client, and Bluetooth device data.
-
QBSS metrics: QBSS Utilization and QBSS Station Count are now reported when available, with visualization options on the Survey Map and columns in the data table.
-
Authorization editing: Device Authorization Class can now be changed directly in the Survey data table; updates apply everywhere that device appears in the current survey.
-
Channel bonding visibility: The Channel Width column now displays bonded channel details in both Analysis and AirMapper tables.
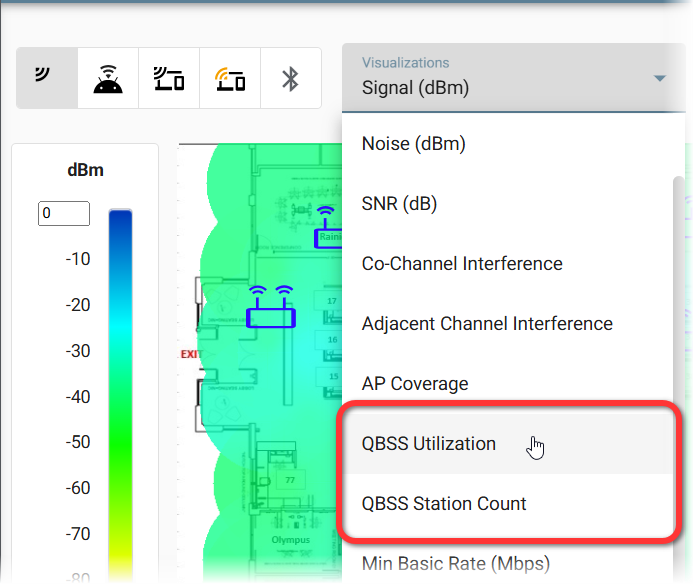
QBSS Measurements
QBSS Utilization and QBSS Station Count measurements are now reported when they are available in the Passive survey data. These are Visualization options for the Survey Map columns in the survey data table.
Change Device Authorization
A device’s Authorization Class can now be edited in the Survey data table. Changes to the Authorization for that device will appear everywhere it appears in the currently viewed Survey.
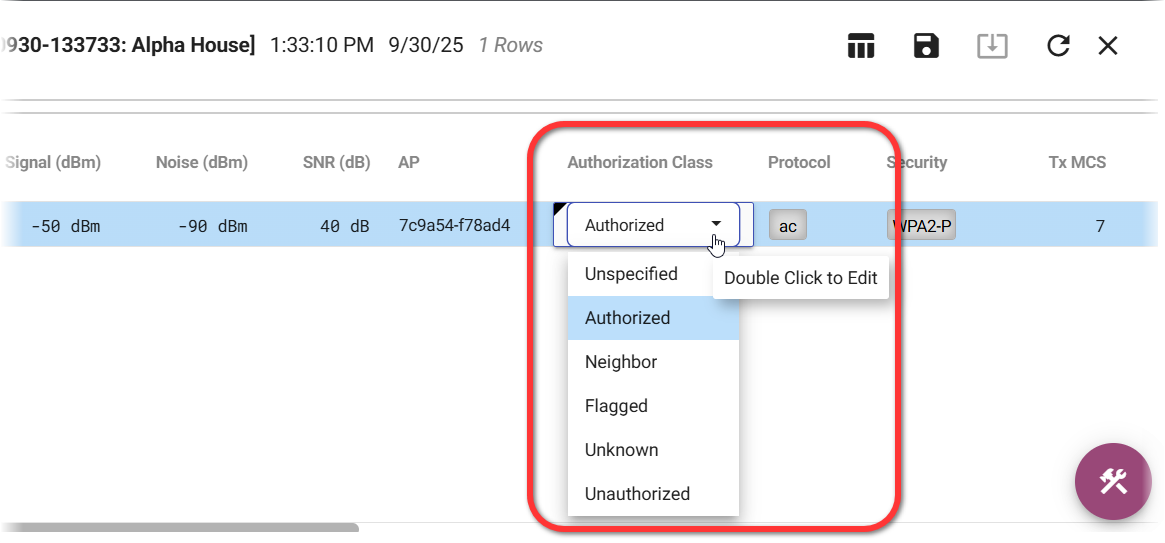
Double-click on the editable field in the data table to edit.
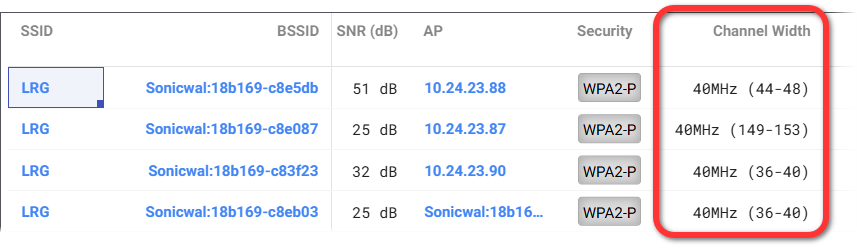
Channel Bonding Data
The Channel Width column now shows details of bonded channels where they are in use, in both Analysis and AirMapper data tables.
Other Survey Updates
-
When a Survey fails to process, a Retry button appears in the page header and allows users to reinitiate processing.
-
Simplified View and Template options streamline view and template creation and management. See the section on Updated Views and Templates.
-
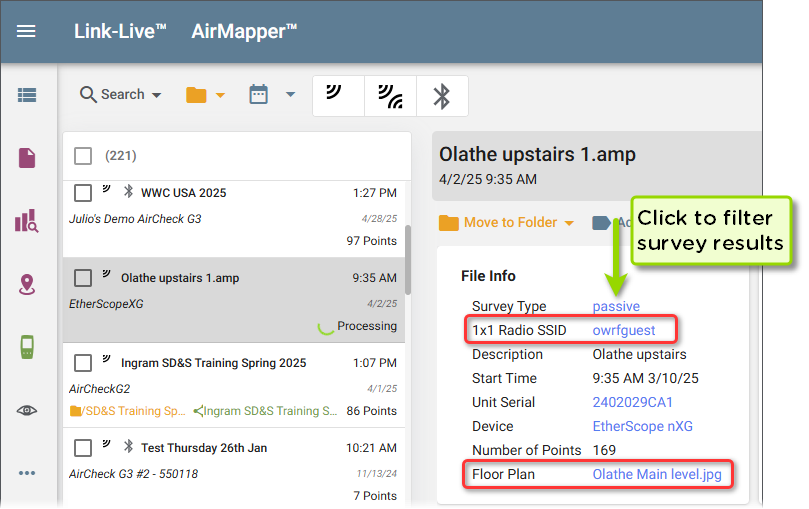
Users can now filter Survey files on the main AirMapper screen by SSID and by Floor Plan file name. Click the blue links under File Info to filter for that element.
InSites Updates
Link-Live’s InSites feature provides automatic analysis of survey data with quick Pass/Fail results using customizable thresholds and criteria based on your network design requirements.
InSites analysis has been expanded with new options and better integration into workflows.
-
Access from the right-side menu on the unified survey map for quicker setup.
-
Supports more data types, including Active survey results.
-
Org-wide defaults: Save configurations as the default for your entire organization.
-
Expanded thresholds: Additions include QBSS Utilization, QBSS Station Count, Active signal strength, Active SNR, and Active TX rate.
-
Views integration: Generate a View directly from current InSites settings for use in Templates and Reports.
-
Scrollable tables make large result sets easier to review.
New Menu Location
The InSites feature is now accessible from the top of the new right-side menu.
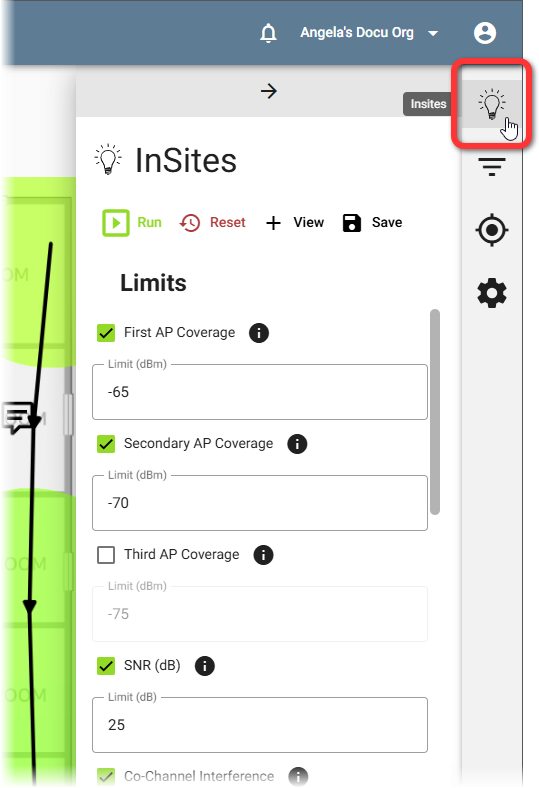
You can configure and Run InSites for Active and Passive data from the new unified survey map screen.
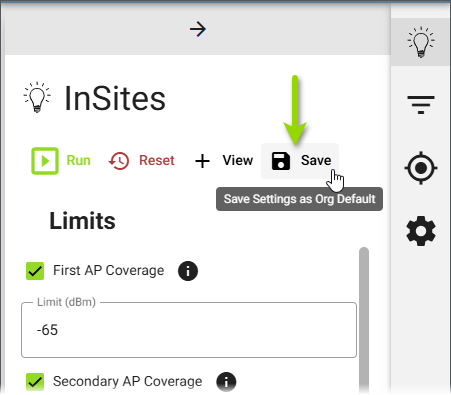
Save Default InSites Configuration
InSites configurations can be Saved to set them as the default InSites configuration for the entire organization. Click the Save button near the top of the InSites slide-out box.
Create Views from InSites
Users can also now create a View from the current InSite configurations and add the View to Templates and Reports. See more about Views and Templates later in this document.
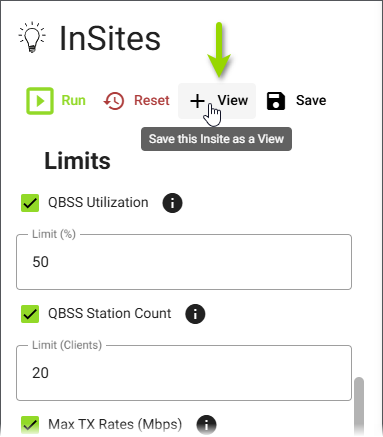
New Limit Options: QBSS and Active Measurements
QBSS Utilization and QBSS Station Count are now included as configurable thresholds and pass/fail gradings in InSites.
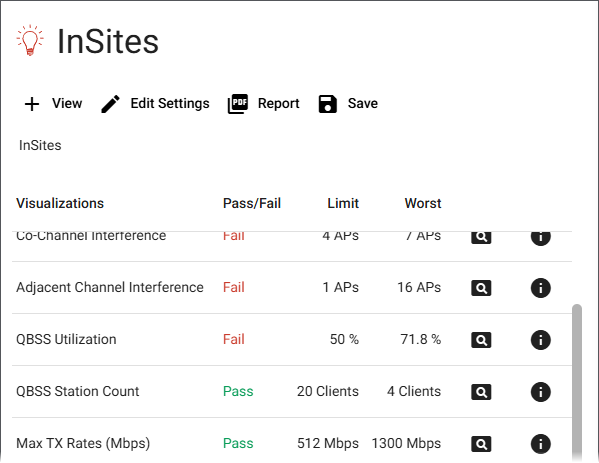
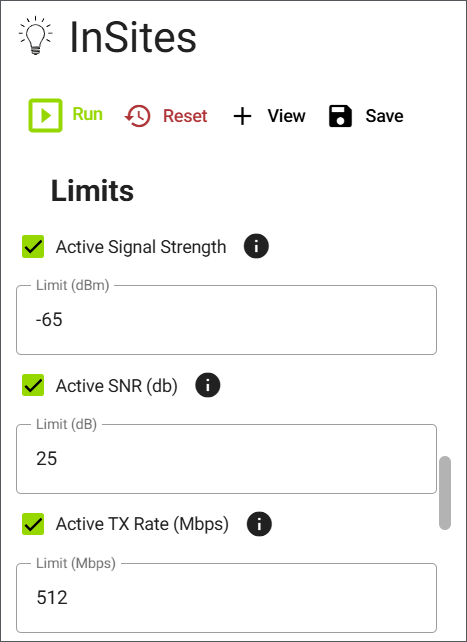
Additions to InSites options also include Active Signal Strength, Active SNR, and Active TX Rate.
Locations Updates
New Right-side Sub-Menu
Device location management has been expanded beyond APs. Link-Live’s former AP Locations checkbox option now has its own slide-out box within the new right-side menu.
In addition to viewing and adjusting the locations of APs, you can now view and adjust the locations of Clients, Probing Clients, and Bluetooth devices.
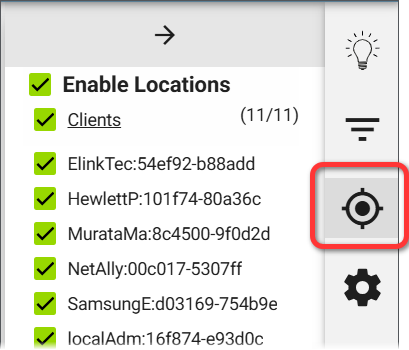
Use the hand tool to adjust device locations on the floor plan when Locations are enabled.
Updated Views and Templates Workflow
AllyWare Testers: Analysis—EtherScope nXG, CyberScope, CyberScope Air, CyberScope XRF, AirCheck G3, LinkRunner 10G, LinkRunner AT 4000;
AirMapper—EtherScope nXG, AirCheck G3, CyberScope, CyberScope Air
This release introduces multiple improvements to the process of creating and managing Views and Templates:
-
New Manage Views & Templates dialog with options to review, apply, and delete saved items.
-
Drag-and-drop support: Views can now be added directly into existing Templates.
-
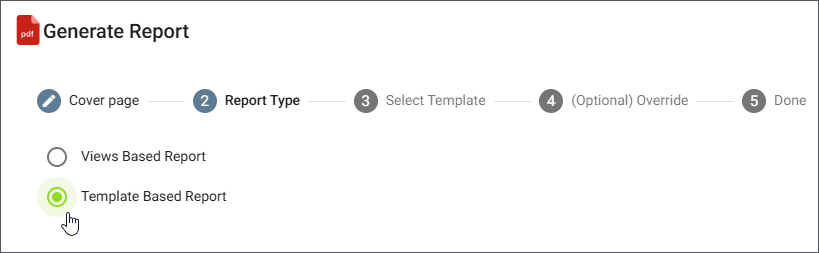
Report generation flexibility: Reports can now be created from either Views or Templates.
Managing Views and Templates
A saved View captures all configurations and filters currently displayed. Views are the building blocks for Templates and Reports. Views are always tied to a specific result file while Templates are tied to the result type.
Views and Templates can be created in Discovery and Wi-Fi Analysis results and AirMapper Surveys. Templates persist across the same type of result data/feature area of Link-Live, with each area (Discovery, Wi-Fi, AirMapper) maintaining its own set of Templates.
To create or manage Views and Templates, open the floating action menu from the following locations: a Survey map in AirMapper, a Discovery Analysis screen (Graph, Details, or Topology), or a Wi-Fi Analysis screen (Graph or Details).
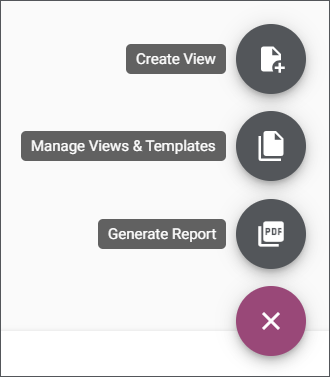
From there, select Manage Views & Templates.
The updated Manage Views & Templates dialog allows you to review Details, Apply, and Delete saved views and templates.
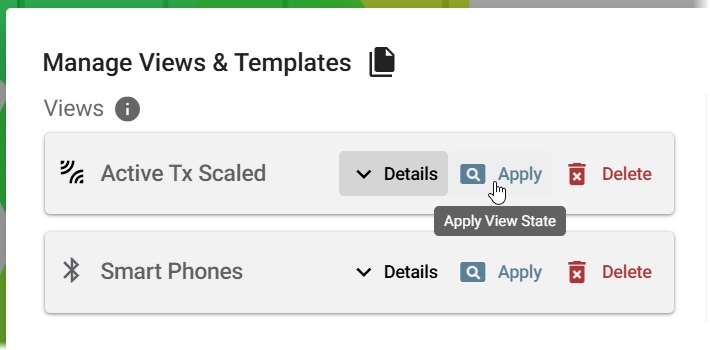
The updated dialog also lets you drag Views into existing Templates, making it easier to build and reuse configurations.
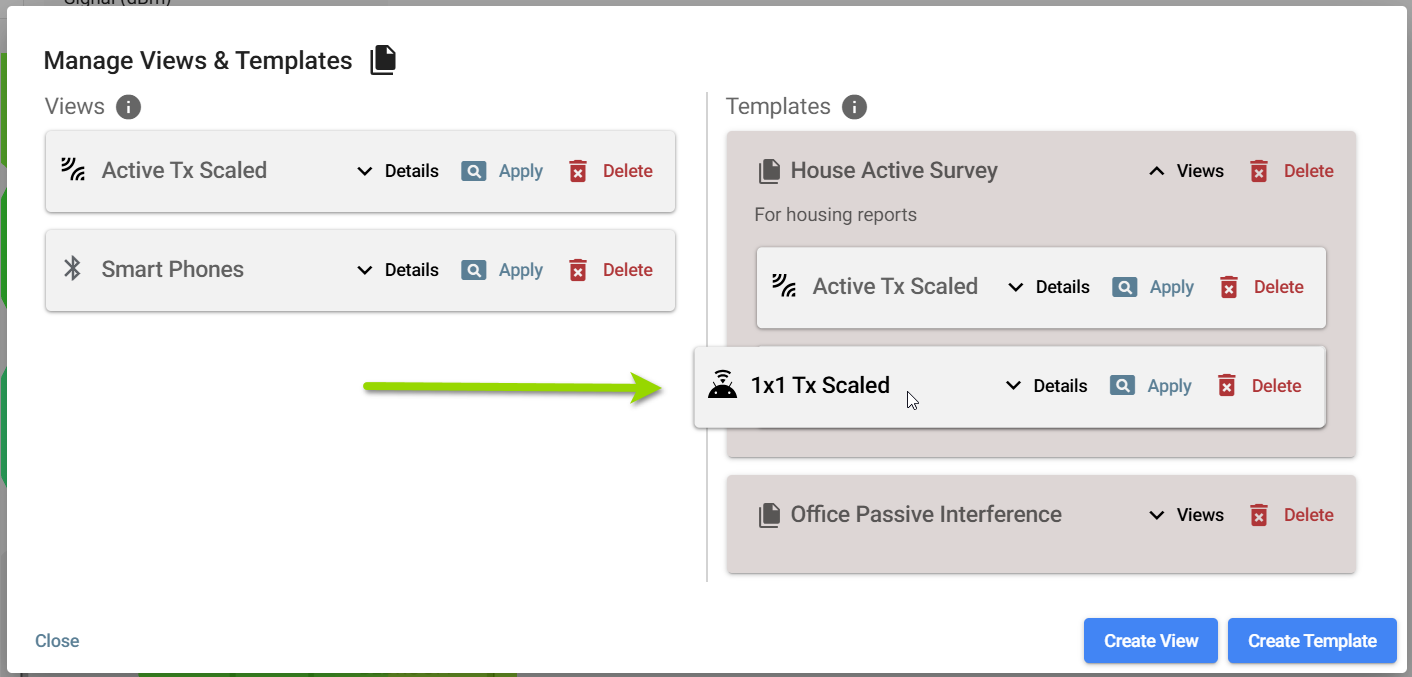
Finally, you can now Generate Reports from either Views or Templates.
Discovery Analysis Enhancements
AllyWare Testers: Discovery—EtherScope nXG, CyberScope, CyberScope Air, CyberScope XRF, AirCheck G3, LinkRunner 10G, LinkRunner AT 4000
Discovery details now provide more visibility and editable fields:
-
The User Name field is now displayed in switch details when available.
-
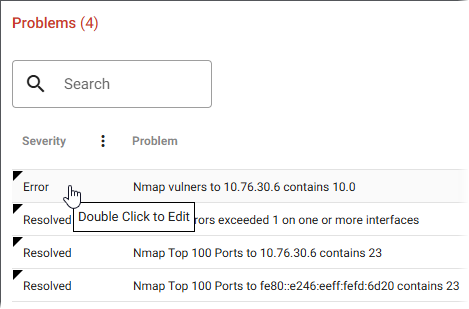
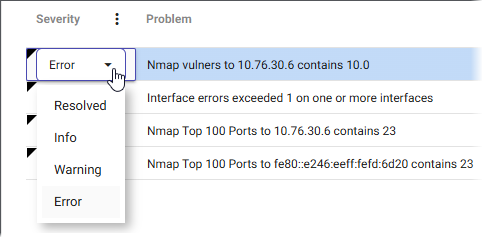
Comments, Problem Severity, and Authorization Class can be edited directly in device details by double-clicking the field.
-
The Problem Severity status in a discovered device’s details provides a drop-down menu for selecting a new Severity. Options are Error, Resolved, Info, and Warning.
Discovery Monitoring Improvements
AllyWare Testers: Discovery—EtherScope nXG, CyberScope, CyberScope Air, CyberScope XRF, AirCheck G3, LinkRunner 10G, LinkRunner AT 4000;
Wi-Fi—EtherScope nXG, AirCheck G3, CyberScope, CyberScope Air
Monitoring now provides better visibility into network changes:
-
A new Topology view has been added to Monitoring.
-
Compare Differences allows you to select two monitoring snapshots and highlight what has changed.
-
New and missing nodes are shown in color in both the Topology view and the Details view.
Monitoring Topology and Compare Differences
Select the Topology view button at the top left of the Monitoring screen. The Topology screen allows you to view a single snapshot or compare two different snapshot files.
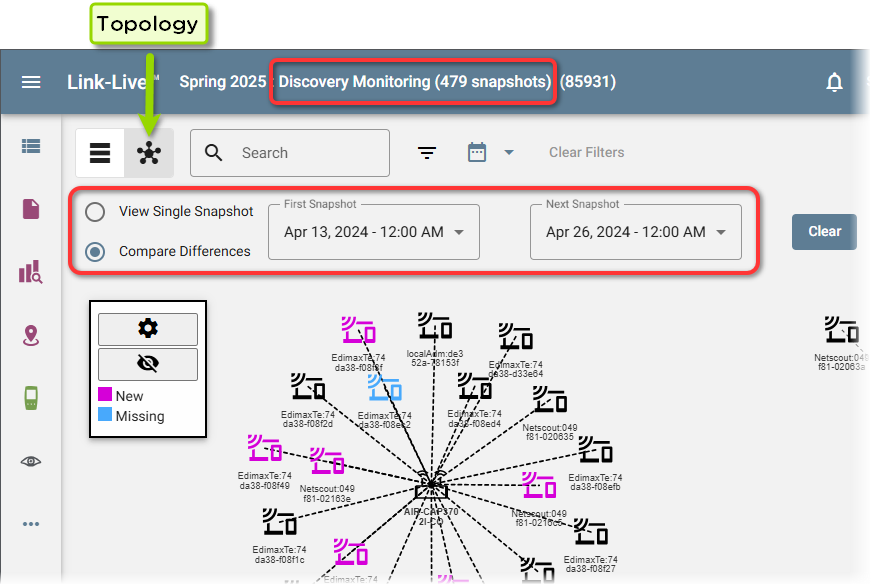
To compare two snapshots of Discovery Monitoring data, select the Compare Differences radio button, and then select the two snapshots to compare from the two drop-down menus.
Other Enhancements
Users can now supply a phone number and company name when signing up for Link-Live cloud service.
Fixed Bugs
LL-5044: Fixed issue causing large Visio reports to display a “report too large” error.