Running Path Analysis
Tap the START button at the top of the app screen to begin a Path Analysis.
NOTE: EtherScope must be linked on the Interface (Port) selected in the Path Analysis app's settings. See Test and Management Ports for help.
In this Topic
The Link-Live upload icon ![]() in the app header indicates the status of uploaded or saved test results. Tap the icon to upload manually and enter comments. See Uploading Test Results and Files in the Link-Live chapter.
in the app header indicates the status of uploaded or saved test results. Tap the icon to upload manually and enter comments. See Uploading Test Results and Files in the Link-Live chapter.
Path Analysis results are uploaded to the Analysis page  on Link-Live.
Test Result Cards
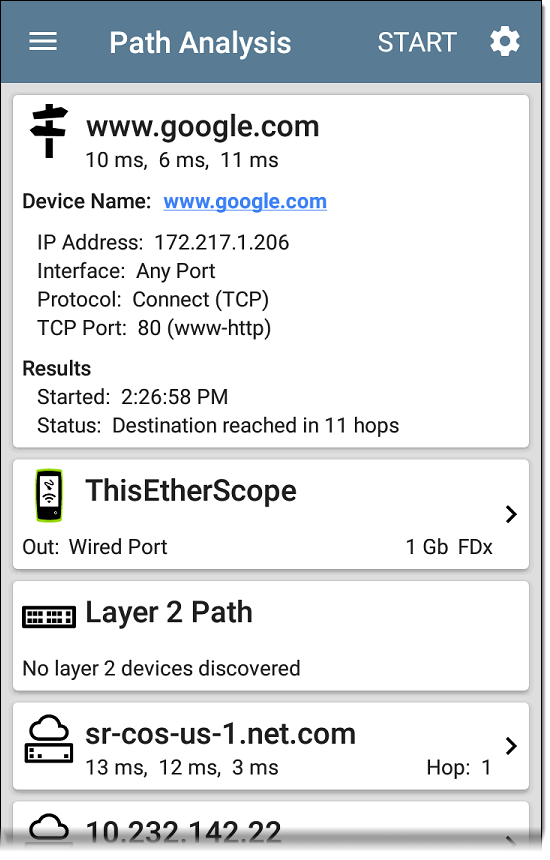
Like AutoTest, Path Analysis results are presented on cards. The top card shows the main test details, the second card shows information for the source device (your EtherScope nXG), and the following cards show the Layer 2 and Layer 3 Hops in the path, which are sequentially ordered.
Tap any blue linked name or address in the Path Analysis results screens to open the Discovery
Summary Card
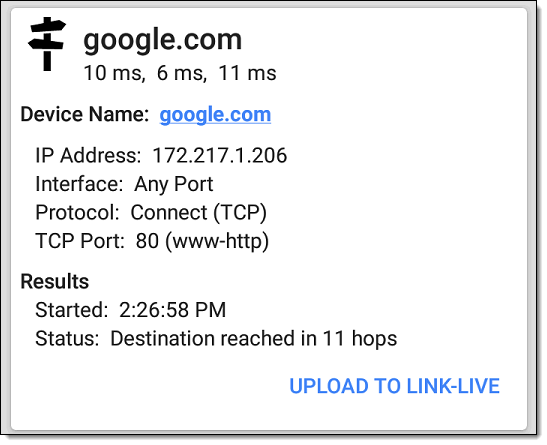
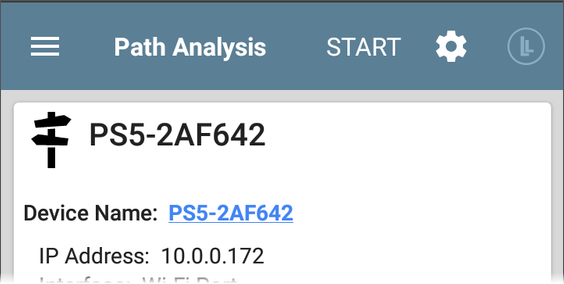
The top Path Analysis results card shows the path's Destination address at the top, followed by the three response times from the TCP Connect, Ping, or Echo tests.
Device Name: Resolved DNS name or IP address of the destination entered in the settings
Results
Source EtherScope Card
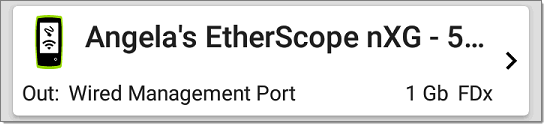
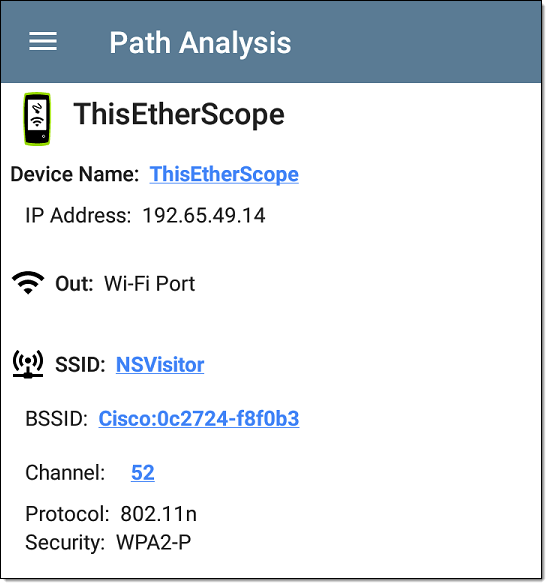
This EtherScope card displays the port from which the Path Analysis ran.
For Wired Test or Management port analyses (shown above), this card displays connection speed and duplex.
For Wi-Fi port analyses, the card displays the SSID and channel number.
NOTE: This card and screen only display a custom name for your EtherScope if you have claimed it to Link-Live.
Tap the card to view more details.
Under the EtherScope source card, the Hop cards show Layer 2 and Layer 3 devices determined to be in the Path.
Layer 3 Hops
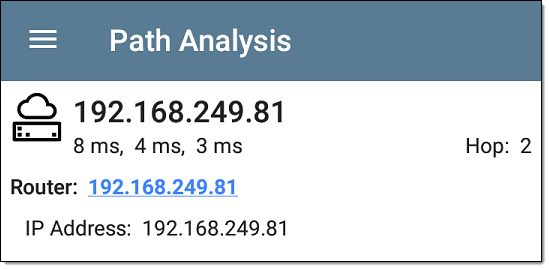
Each Layer 3 Hop card displays the device type icon, DNS name (if discovered), and IP address.
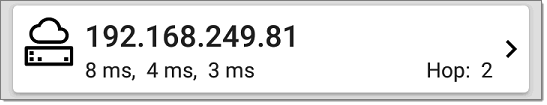
Beneath the name (or IP), the response times for each Connect (TCP), Ping (ICMP), or Echo (UDP/7) display in milliseconds. On the right side is the router Hop number of this device in the path.
Tap the card to view the hop Details screen.
No Reply
Sometimes Path Analysis displays Hop cards with "No Reply" (as shown below). This result means that the device in that portion of the path did not send an ICMP TTL timeout response.
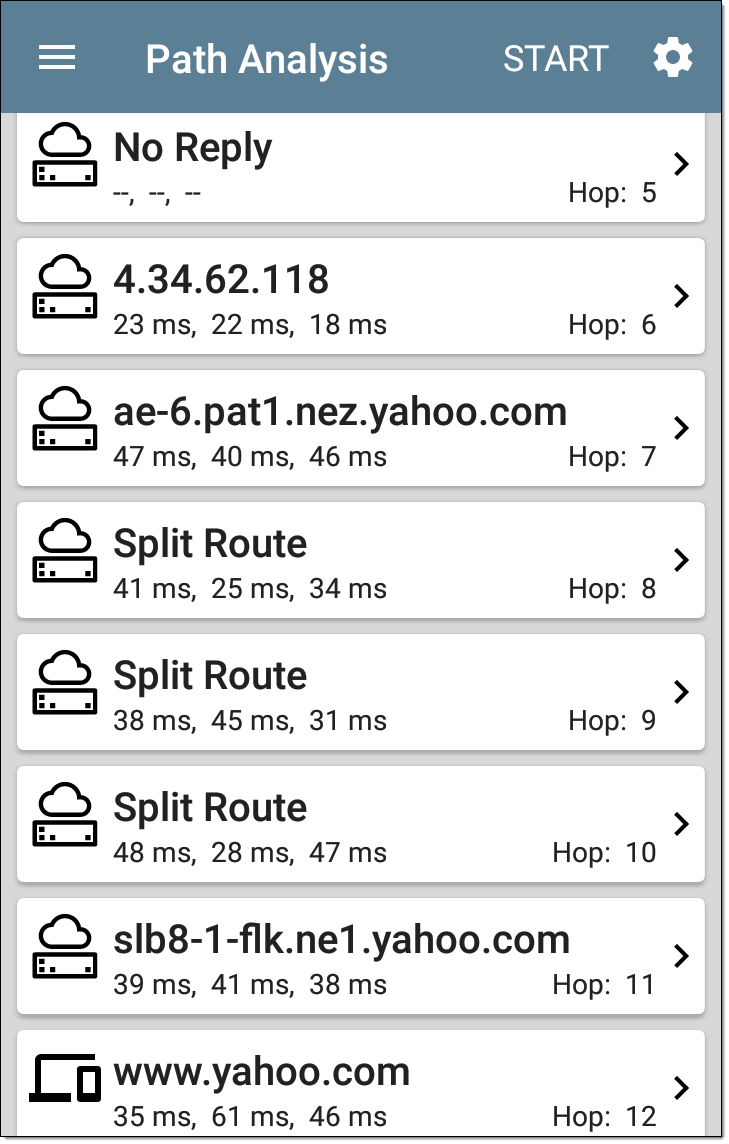
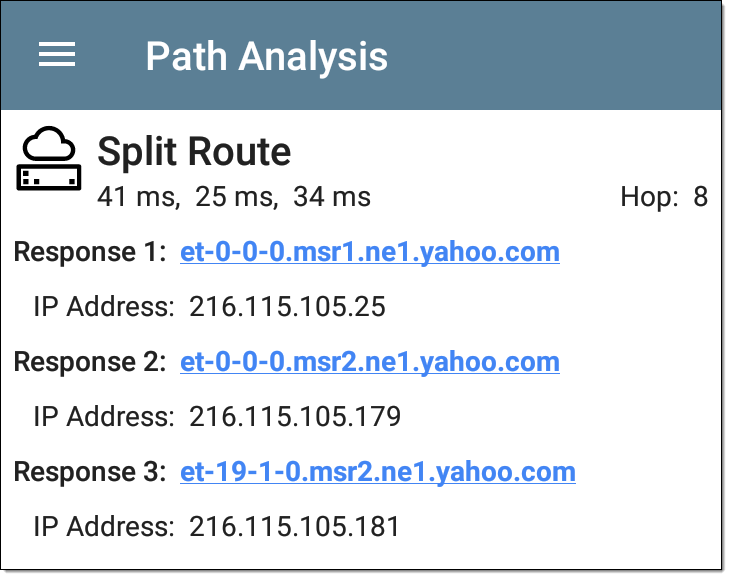
Split Route
Path Analyses may obtain a "Split Route" result (as shown above), meaning that two or three different routers within same hop responded to the three requests.
Tap a Split Route card to view the DNS names and IP addresses of the responding routers.
Layer 3 Interfaces and Statistics
Statistics for Interfaces on Layer 3 devices may be identified and measured if the EtherScope has SNMP access.
Tap a Hop card to see a summary of Interface Details and Statistics, if they are available.
See also Layer 2 Switch Interfaces and Statistics below.
Network Problems in Path Analysis
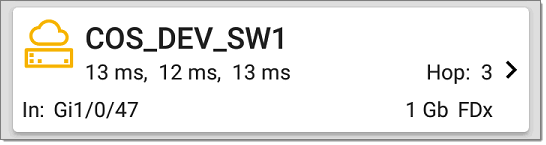
The Hop cards can also show detected Problems based on the Problem Settings in the Discovery app and display the device type icons in the corresponding colors.
The yellow switch icon in the image above indicates a Warning status.
Tapping the blue linked switch name opens a Discovery Details screen for the switch, where the user can investigate the cause of the Warning.
Layer 2 Devices
Layer 2 devices can be switches or APs.
Layer 2 Switches
The image below displays an example of a Path Analysis to a device on the local broadcast domain with two switches in the Layer 2 portion of the path.
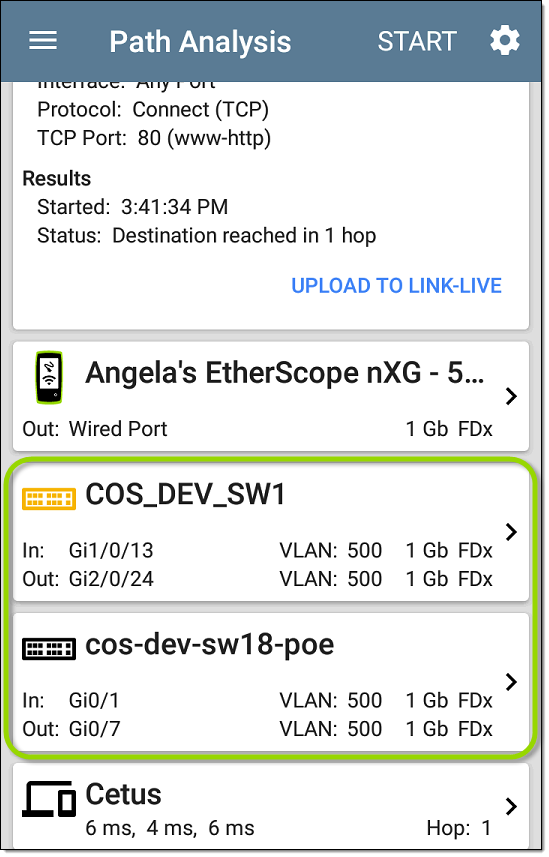
The EtherScope is able to identify these Layer 2 switches and their interfaces because it has configured SNMP access to the switches.
The switch cards display the In and Out Interface IDs, VLAN ID, and the link speed and duplex (if detected) of the interfaces.
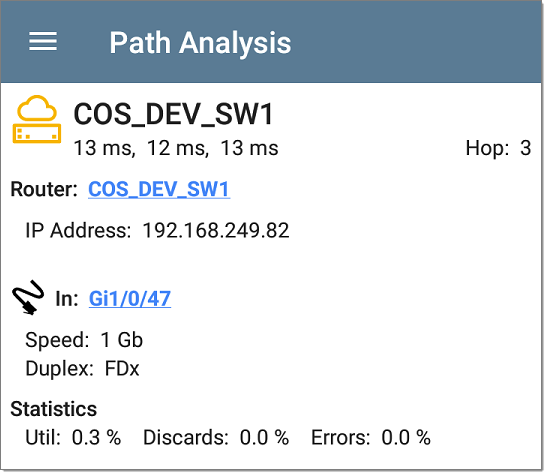
Tapping a Layer 2 card opens a Details screen for the device.
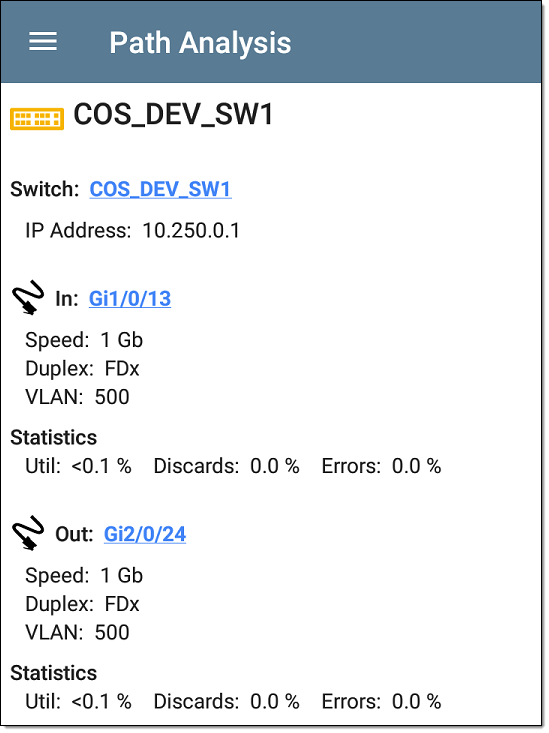
A Layer 2 Details screen displays the device name and IP address at the top.
NOTE: The yellow switch icon in the image above indicates a Warning status. See Network Problems in Path Analysis later in this topic.
Layer 2 Switch Interfaces and Statistics
Layer 2 Switch Details screens in Path Analysis display a summary of the Interface Statistics (described below). To view all available information for these interfaces, tap their blue links to open a Interface Details screen in the Discovery app.
Statistics for Interfaces on Layer 2 switches may be identified and measured if the EtherScope has SNMP access.
In/Out: Indicates the interface type and name. The interface name often contains the physical port number where the switch is connected to the network.
Layer 2 APs
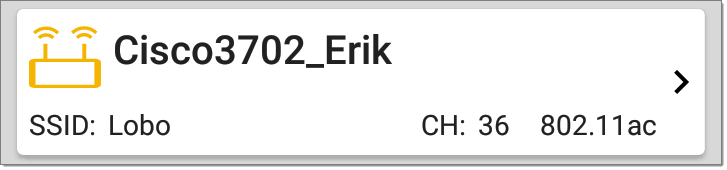
If the Layer 2 path starts or ends with a Wi-Fi device, its AP is shown as a Layer 2 device in the path.
A Layer 2 AP card indicates the connected network SSID, channel, and 802.11 type in use.
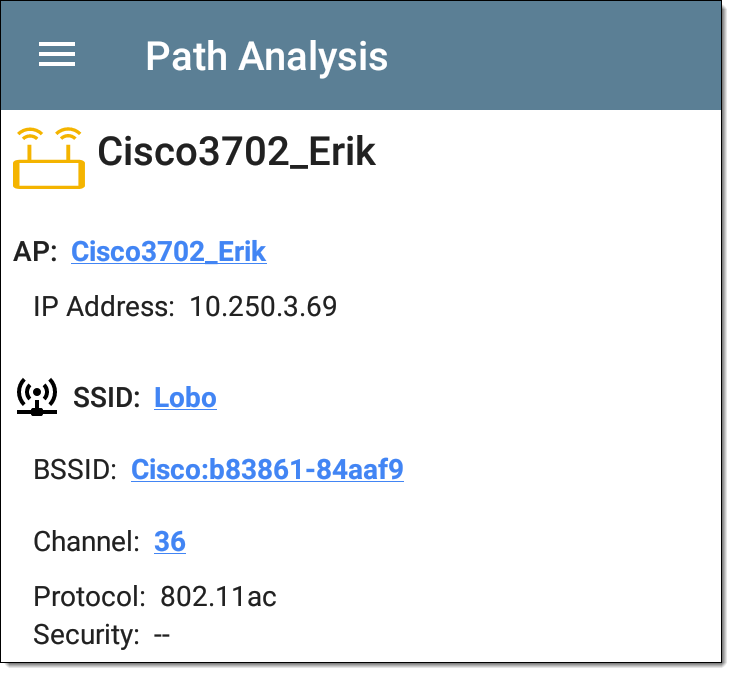
Layer 2 AP Details screens allow you to further examine the wireless characteristics by selecting their blue links, which open a Wi-Fi app Details screen.
No layer 2 devices discovered
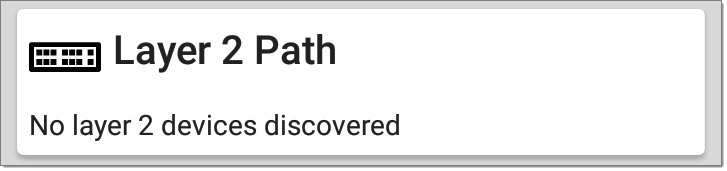
In some cases, the EtherScope does not discover Layer 2 devices between Layer 3 devices. There may not be any Layer 2 devices, or EtherScope might not have SNMP access to those switches.
The Layer 2 card may also display a result of "No switches found," which indicates that Discovery has not found any switches with SNMP access to determine if the switches are in the path. If this is an unexpected result, check and verify your SNMP Configuration and Extended Ranges in the Discovery app settings.