Viewing Performance Test Results
Note the following before running:
-
The Performance Test can only run from the Wired Test Port (top RJ-45 or Fiber port), and an AutoTest Wired Profile must connect successfully to establish link on the port. If you receive a Status message such as "The wired test port is not linked" or "No IP address" but you have an active network connection, go to AutoTest and run a Wired Profile to troubleshoot your connection.
-
All configured Performance Test Services are tested at the same time. If one Service fails to meet the thresholds for the test, the entire test fails.
-
Only four Services can run at once. If you have selected more than four Services in the Performance Settings, the test fails with the Status message, "Too many services enabled (56)."
-
Newly configured Services may not display on the main Performance Test screen until you tap START.
To run your configured Performance Test, tap START on the main Performance screen.
Performance Test Results
Performance results update every five seconds if you are using only Reflector endpoints, and/or a NetAlly tester Peer running v1.2 or newer software, with a test Duration of 4 hours or less. If you are running a 10 second test, all results display after 10 seconds. Otherwise, results update every 30 seconds.
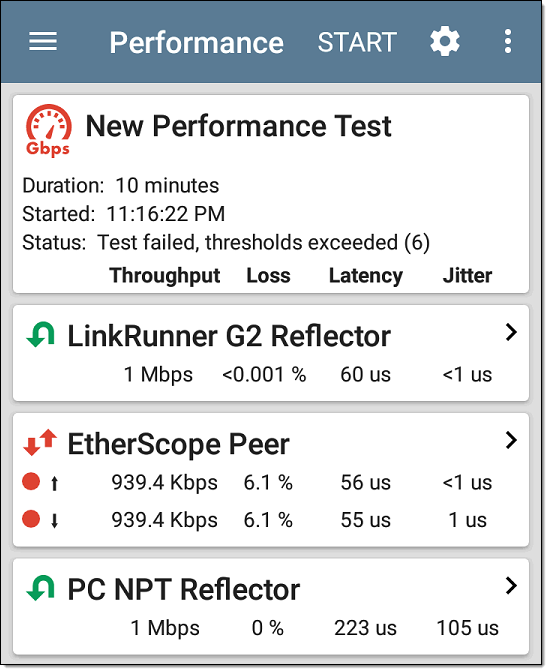
Performance Test results are presented on cards. The top card shows the test duration and status.
Duration: The test duration selected in the Performance Settings
Started: Time at which the test began
Status: Current status of the test, including any error messages
Each card beneath corresponds to a configured Service and displays the Up, Down, or Round Trip measurements for Throughput, Loss, Latency, and Jitter. Remember, Peer endpoints can return Upstream and Downstream measurements, while Reflectors only provide round trip measurements.
Tap a Service card to view more details.
Performance Service Detailed Results
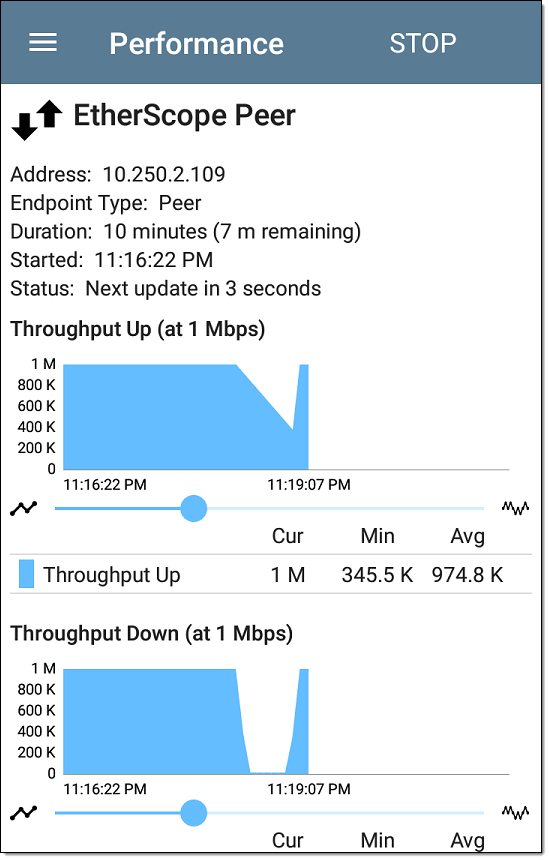
The Service results screen displays detailed test characteristics and graphs of performance.
Address: IP address of the endpoint
Endpoint Type: Peer or Reflector
Status: Current status of the test, including any error messages
Rerunning Tests from Detailed Results
You can rerun a Performance Test from the detailed results screen by tapping Start at the top of the screen. This repeats the Performance Test only for the Service that you are viewing.
Throughput, Loss, Latency, and Jitter Graphs
The graphs described in this section update every 5 or 30 seconds for as long as the test is running. The graphs save and display data for the entire test duration, with a max duration of 24 hours.
Peer endpoints display separate Up and Down graphs (as shown below) for Throughput, Frames Lost, Latency, and Jitter, while Reflector endpoints display one round trip measurement for each.
Touch and drag (or swipe) left and right on each graph to move backward and forward in time, and double tap or move the slider to zoom in and out. See the Trending Graphs topic for an overview of the graph's pan and zoom controls.
Graph Legends
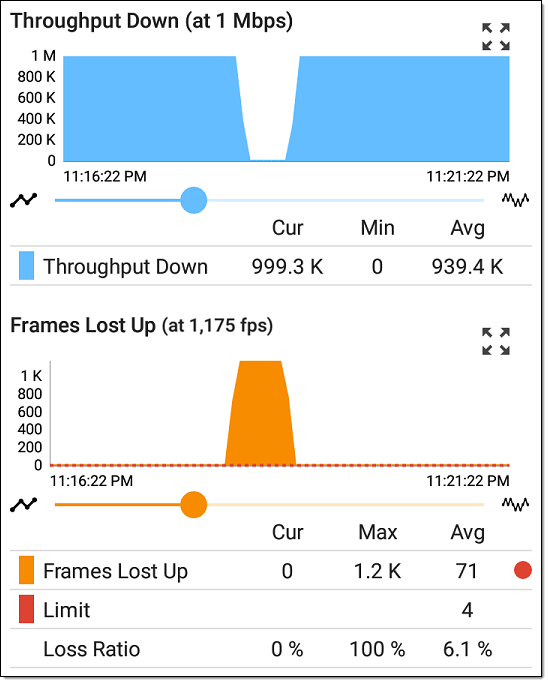
Under each graph, a legend table indicates the meanings of the colors that correspond to different measurements. The Limit shown for each graph is the set Threshold from the corresponding Service settings. Measurements that fall outside the Limit are indicated with a red dot next to the failing measurement. In the image above, the test has failed because Frames Lost Up was above the Limit.
The table also displays the Current, Maximum, and Average measurements. The Current columns contain measurements from the last interval (5 or 30 seconds). The Min, Max, and Avg columns show cumulative measurements gathered during the test duration.
Throughput
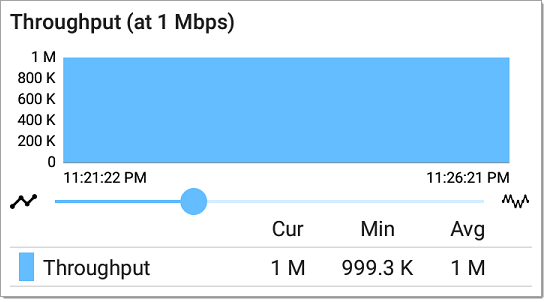
Throughput (Up/Down) (at Target Rate): Throughput is the measured bit rate based on the number of frames sent and frames received.
The configured Target Rate from the Performance Settings is shown in parentheses next to the Throughput heading. In the image above, the configured Target Rate is 1 Mbps.
Loss
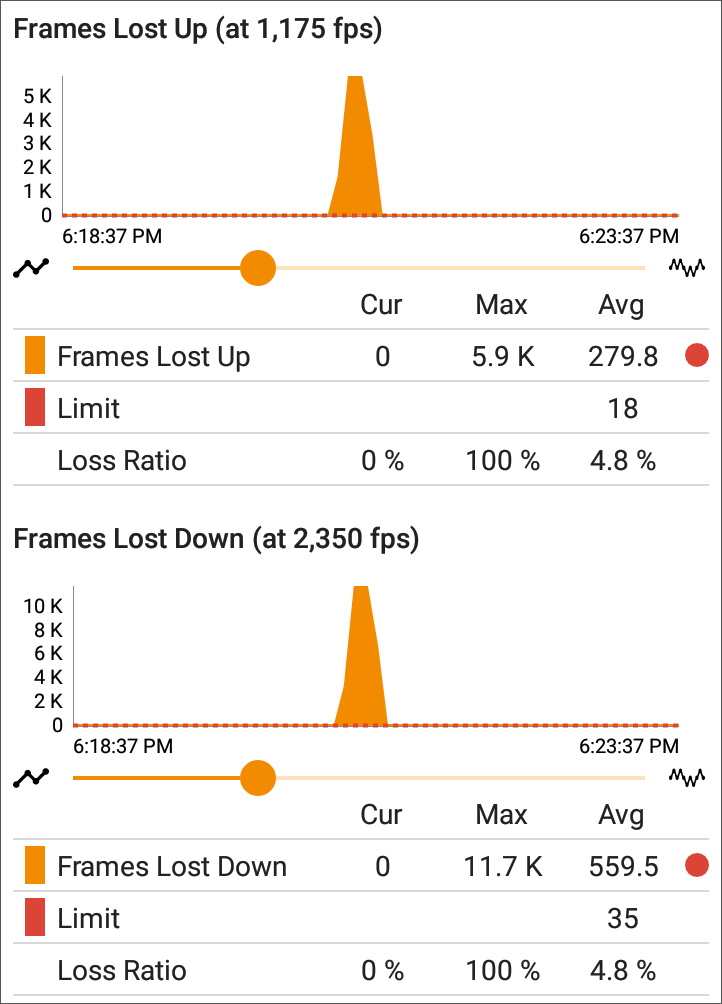
Frames Lost (Up/Down): Frame loss is quantified by the number of frames received subtracted from the number of frames sent.
Limit: This is the Frame Loss Threshold for one interval. It is computed from the Frame Loss Threshold, Frame Size, and Bandwidth settings for the Service. The Limit is also displayed on the graph as a horizontal red dotted line (if the measurements are close enough to the Limit value for it to appear on the graph).
Loss Ratio: The percentage of total frames that were lost
NOTE (for 10G Rate Performance tests): Low-level electrostatic discharge (ESD) and low-power Electric Fast Transient (EFT) events, also called impulse noise, can interfere with newer, faster data links with less noise margin. These events could include static from a person's clothing or interference from electrical appliances and motorized equipment. When running a full 10G line rate test, ESD and EFT events can cause periodic spikes or a spike that then resolves on the Frame Loss graph.
Latency
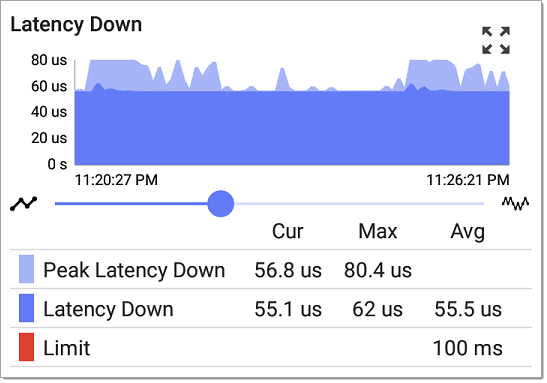
Latency (Up/Down): Latency is the amount of time it takes for a packet to go from the source to the endpoint or from the endpoint to the source (in milliseconds). Latency is calculated by averaging the thousands of latencies measured during each interval. One-way latency measurements consist of the round-trip measurements divided by two.
Peak Latency: The highest measured latency. The Current column shows Peak Latency from the last test interval, and Max shows the highest latency measured during the entire test.
Limit: This is the Latency Threshold from the Performance app's setting.
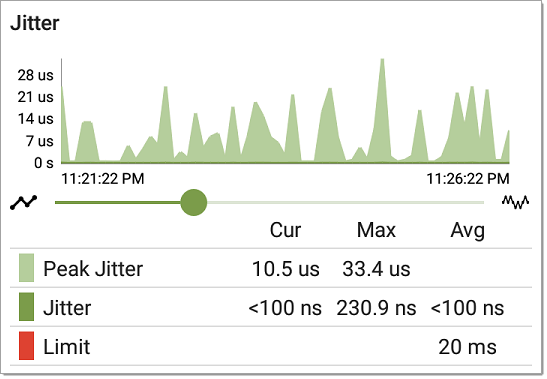
Jitter (Up/Down): Jitter is a measure of the variation in frame-to-frame latency in milliseconds.
Peak Jitter: The highest measured Jitter. The Current column shows Peak Jitter from the last test interval, and Max shows the highest Jitter measured during the entire test.
Limit: This is the Jitter Threshold from the Performance app's settings.
Uploading Results to Link-Live
The Link-Live upload icon ![]() in the app header indicates the status of uploaded or saved test results. Tap the icon to upload manually and enter comments. See Uploading Test Results and Files in the Link-Live chapter.
in the app header indicates the status of uploaded or saved test results. Tap the icon to upload manually and enter comments. See Uploading Test Results and Files in the Link-Live chapter.
NOTE: To enable or disable Automatic Uploading for Performance tests, see Automatic Upload Settings in the Link-Live app topic.
You can also upload image files of the graphs from a Service results screen to Link-Live and attach them to the main test results. From the main Performance test screen, tap a Service card to view the Service's detailed results, then tap the Link-Live upload icon ![]() at the top right of the screen, and select Upload graphs to Link-Live.
at the top right of the screen, and select Upload graphs to Link-Live.
See the Link-Live chapter for more information.