Wi-Fi Profile Test Results
The image below shows a completed AutoTest Wi-Fi Profile.
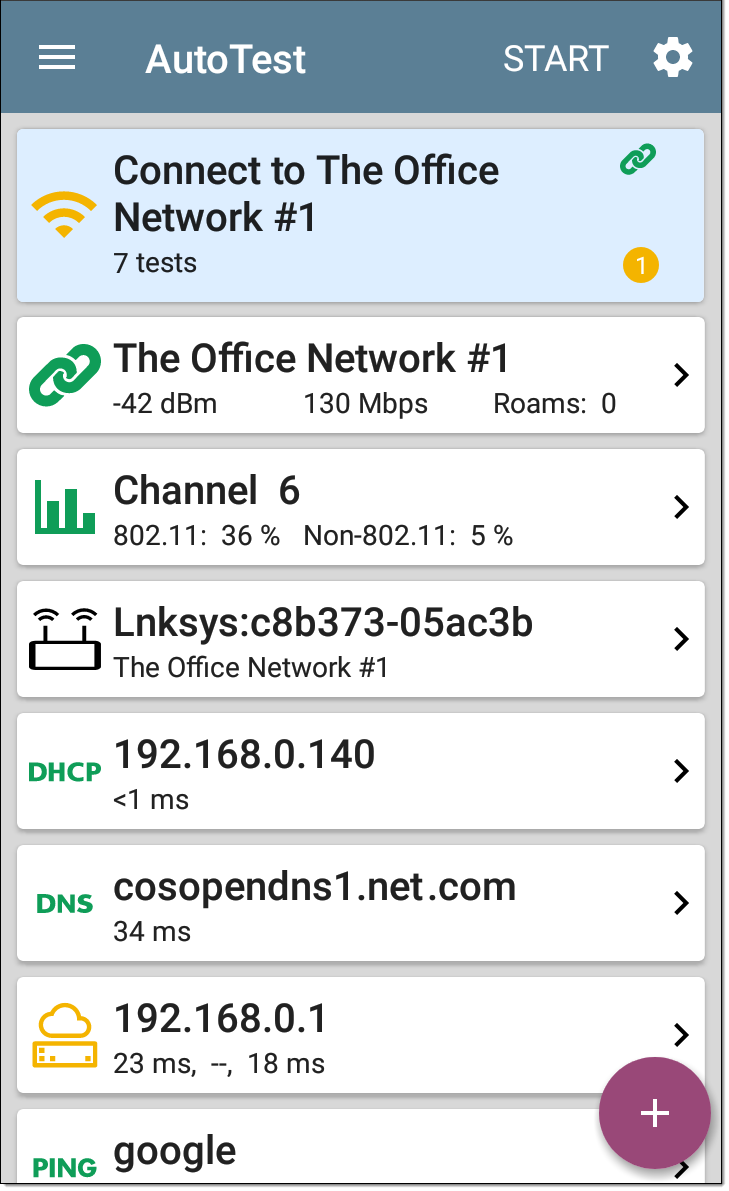
This Profile connects to SSID "The Office Network #1." The Profile is displaying one Warning condition from a timeout of the second Gateway ping.
In this Topic
Other Actions (Wi-Fi Profile FAB)
Main Screen Actions
On the Wi-Fi Profile screens, you can perform these actions:
-
Tap any of the test result cards, like
 Link ,
  Channel, or
  AP, to open the individual test result screens.
 -
From any individual test screen, tap the settings icon
 to go directly to the settings for the current test.
 -
On individual test screens, tap blue underlined links to open a Wi-Fi app Details screen showing the selected device or ID.
-
Tap other BLUE LINKS or the action overflow icon
 at the bottom of test results screens for additional actions.
The individual test cards and screens using the Wi-Fi Profile results for the "LRG" SSID are shown below.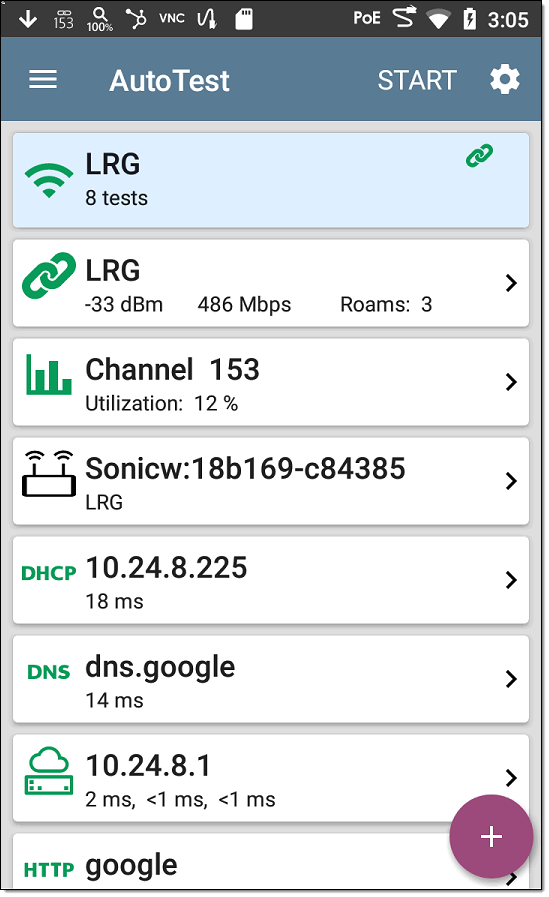
Wi-Fi Link Test Results
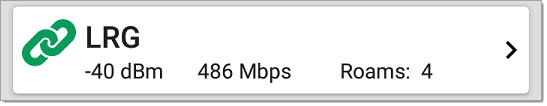
The Wi-Fi link test card indicates whether you can connect to the configured network at your current location. The Wi-Fi Link card displays the SSID, current signal strength (dBm), link speed (Mbps), and number of roams.
Refer to Wi-Fi Connection Settings if needed.
Tap the card to open the Link test screen.
Wi-Fi Link Test Screen
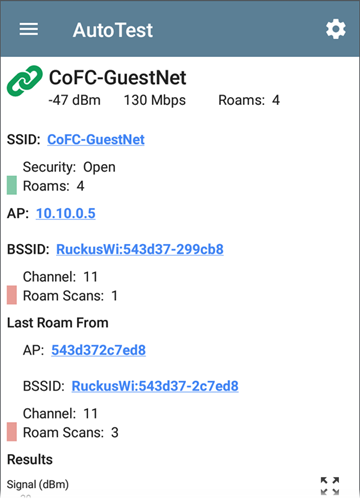
The Wi-Fi Link test screen shows these results:
SSID
AP: Name, IP, or MAC address of the AP to which the Tester is connected, depending on the information EtherScope can see about the AP. This field shows the custom User Name if one has been entered. See Assigning a Name and Authorization to a Device.
BSSID: BSSID of the access point
Last Roam From: If the EtherScope has roamed to a new AP, the previous AP's name, BSSID, and Channel display.
Wi-Fi Link Trending Graphs
EtherScope's trending graphs operate similarly across different testing apps, allowing you to pan and zoom to view different time intervals. Swipe, double tap, and move the slider to adjust the graph views. See the Trending Graphs topic for an overview of the controls.
The Wi-Fi Link Test graphs save and display data for up to 24 hours in the past if the unit stays linked. The default time interval shown is 2 minutes.
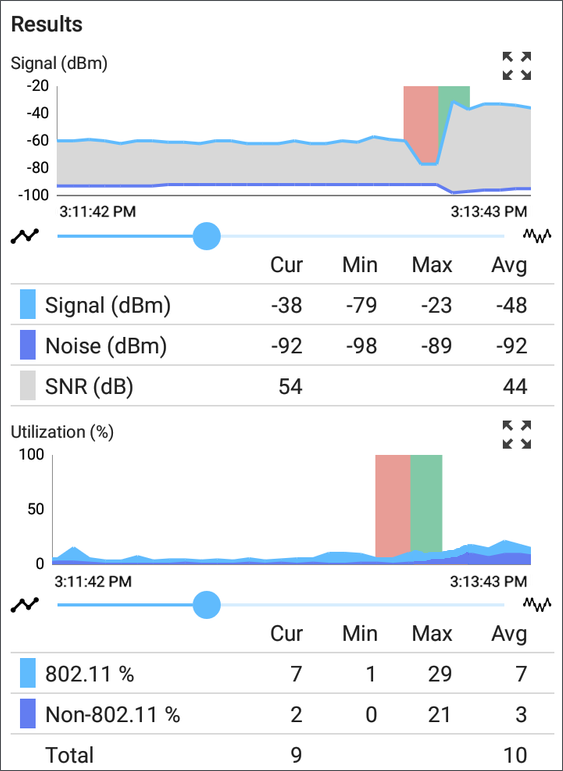
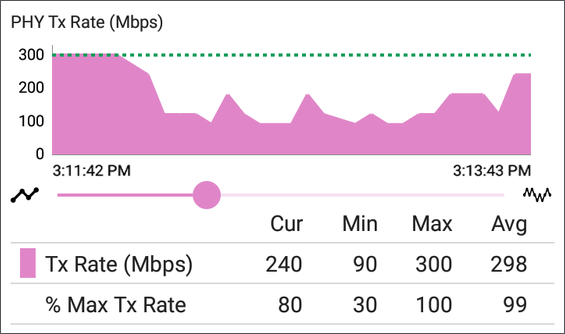
Under each graph, a legend table displays the Current, Minimum, Maximum, and Average measurements. The Current column contains measurements from the last second. Min, Max, and Avg columns show cumulative measurements.
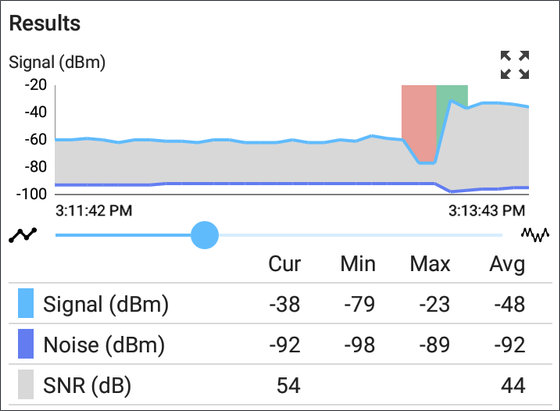
Signal (dBm) graph: Plots the signal strength in dBm of the connected AP.
- Green vertical bars - The tester roamed to a new AP.
- Red vertical bars - (EXG-200 only) The tester made a roam scan.
- Signal - The AP's signal strength in dBm.
- Noise - The noise level in dBm on the channel used.
- SNR - The network's signal-to-noise ratio in decibels (dB).
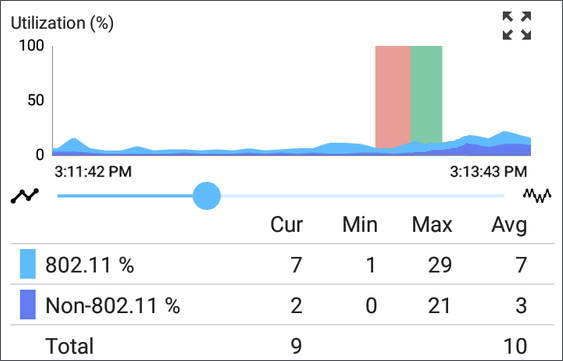
Utilization (%) graph: Plots percentage of the connected channel's capacity being used by 802.11 devices and by non-802.11 interference.
-
Green vertical bars - The tester roamed to a new AP.
-
Red vertical bars - (EXG-200 only) The tester made a roam scan.
-
(EXG-200 only) If the Combine Utilization setting is enabled in General Settings, the Utilization graph shows only combined 802.11 and non-802.11 channel utilization. See the General Settings topic for more information.
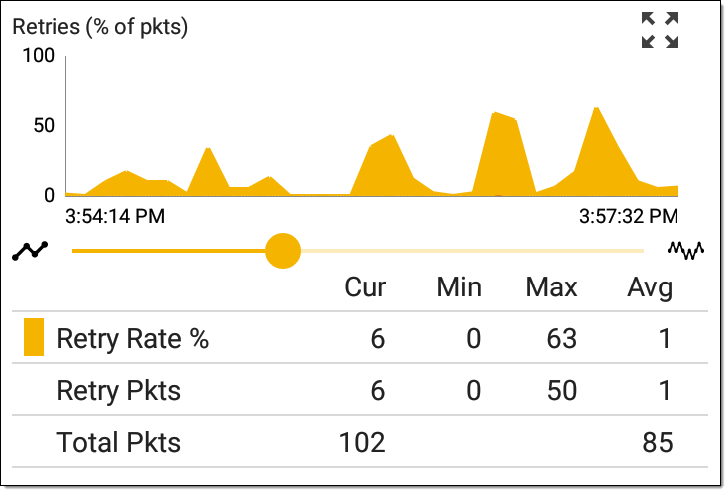
Retries (% of packets) graph: Plots percentage of transmitted packets that are retry packets
- Retry Rate % - The percentage of total packets that are retry packets.
- Retry Pkts - The number of retry packets seen in the current sample cycle.
- Total Pkts - The total number of packets transmitted in the current sample cycle.
PHY TX Rate (Mbps) graph: Plots the physical transmission rate. The green horizontal dotted line shows the AP's maximum TX rate.
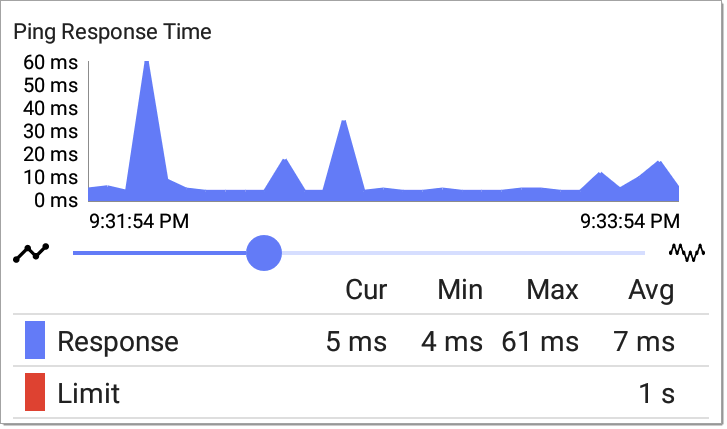
Ping or TCP Connect Response Time graph: This graph displays on the Link test screen if you run a Ping or TCP Connect test, using the Ping/TCP app, over the Wi-Fi test port connection while the Profile is linked.
Follow these steps to view the Response Time graph:
-
Tap the blue PING hyperlink at the bottom of the Link test screen. This opens the Ping/TCP app with the Interface set to Wi-Fi Port and Protocol set to Ping.
-
Access and adjust the Ping/TCP settings as desired.
-
START the Ping or TCP Connect test.
-
Tap back
 to go back to the AutoTest Wi-Fi Link screen. The Response Time graph appears near the bottom of the screen and updates in real time along with the other graphs for the duration of the Ping/TCP test.
Result Codes: Final status of the test (Success or Failure)
Next Actions
Scroll to the bottom of the link test screen to access action links (in blue):
-
Tap PING to open the Ping/TCP app.
-
Tap CONNECT LOG to view the Wi-Fi connection log.
-
Tap the action overflow menu icon
to open an additional menu:-
Tap Capture to open the Capture app to run a Wi-Fi packet capture on the connected channel and AP.
-
Tap Upload graphs to Link-Live upload graphic results to Link-Live. This opens the Link-Live upload screen.
-
Use the default file name (which has a <DATE-TIME> format) or tap the Graphs Image Name field to open a touch keyboard to type a custom name.
-
Tap SAVE TO UPLOADED FILES to upload to the Results page
 on Link-Live.com.
-
-
Connect Log
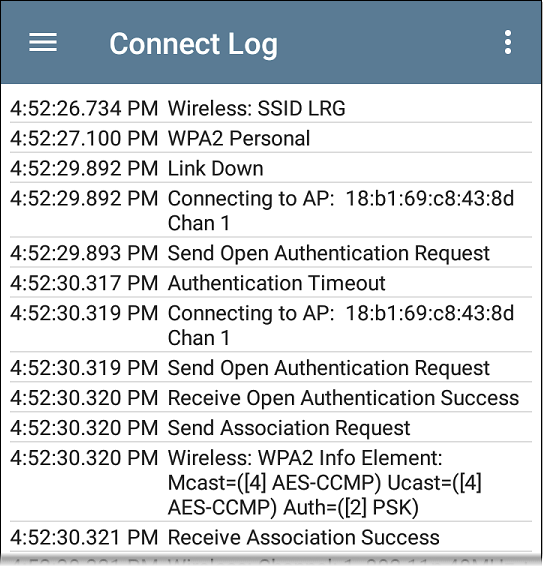
The Connect Log shows the Wi-Fi connections, including driver activity, supplicant, and the DHCP process. The Connect Log can be especially helpful for identifying linking or roaming problems.
Select the action overflow icon  at the top right on the Connect Log screen to attach the log to its associated AutoTest result on the Link-Live website, or attach the Connect Log from the floating action menu
  on the main Profile screen. See Wi-Fi Profile FAB below.
Channel Test Results
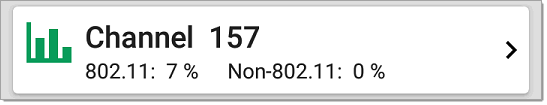
The Channel card shows the channel on which the AP is operating and the current 802.11 and Non-802.11 utilization.
(EXG-200 only) If the Combine Utilization setting is enabled in General Settings, the card shows only combined 802.11 and non-802.11 channel utilization. See the General Settings topic for more information.
Refer to Channel Test Settings if needed.
Channel Test Screen
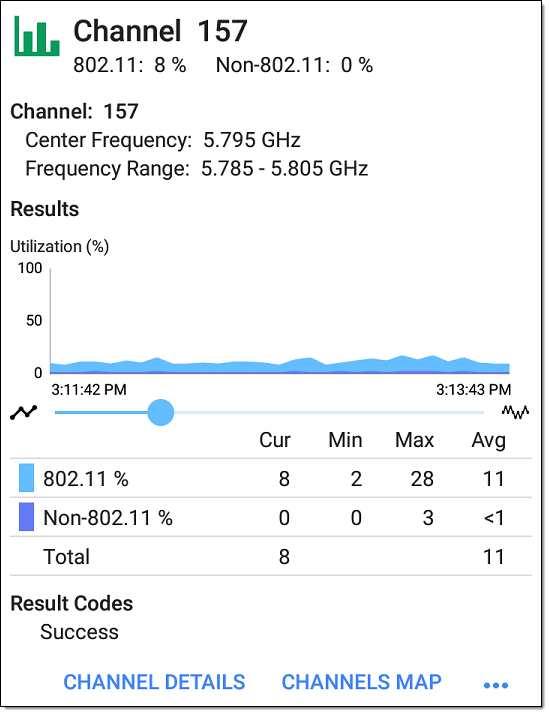
The Channel Test results screen indicates the Center Frequency and Frequency Range of the connected channel along with a real-time Utilization graph.
Results: The channel Utilization (%) graph updates in real time for as long as the unit is still connected to the network. The graph saves and displays data for up to 24 hours if the unit stays linked.
To pan and zoom on the graphs, you can swipe, double tap, and move the slider. See the Trending Graphs topic for an overview of the graph controls.
Utilization (%) graph: Plots percentage of the connected channel's capacity being used by 802.11 devices and by non-802.11 interference.
- 802.11 %: Percentage of channel capacity being used by 802.11 devices
- Non-802.11 %: Percentage of channel capacity being used by non-802.11 interference
- Utilization: (EXG-200 only) If the Combine Utilization setting is enabled in General Settings, the Utilization graph shows only combined 802.11 and non-802.11 channel utilization.
- Total: Total percentage of both 802.11 and non-802.11 channel utilization
Results Codes: Final status of the test (Success or Failure)
Other Actions
Scroll to the bottom of the link test screen to access action links (in blue):
-
Tap CHANNEL DETAILS to open the Wi-Fi app's Channels display.
-
Tap CHANNELS MAP to open the Wi-Fi app's Channels Map display.
-
Tap CAPTURE to open the Capture app to run a Wi-Fi packet capture.
AP (Access Point) Test
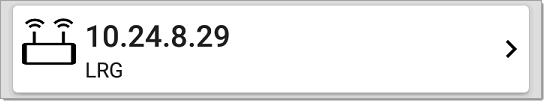
The AP card shows the AP's name and the SSID of the network it is supporting. The AP name or address shown is based on what the EtherScope is able to gather from the device and network. If the AP has a custom user name, that name is shown on the card and test screen.
The AP test is not graded, so the icon remains black.
AP Test Screen
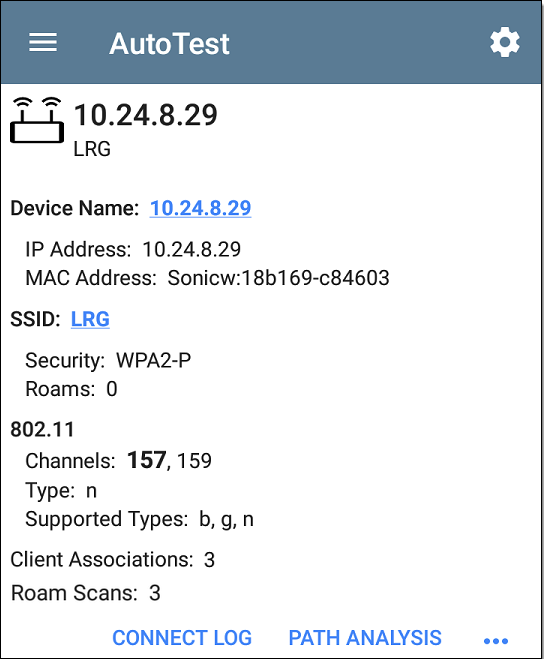
In addition to the AP name and SSID, the AP test screen shows the following:
Device Name: AP's name or address
SSID: Name of the network on which the AP is operating
802.11
Client Associations: The number of client devices connected to the AP
Roam Scans: (EXG-200 only) Number of times the EtherScope has scanned for a new AP supporting the same SSID. Multiple triggers may cause EtherScope to scan for another AP, such as low signal strength or high retry rate.
Other Actions
Scroll to the bottom of the link test screen to access action links (in blue):
-
Tap CONNECT LOG to view the Wi-Fi connection log.
-
Tap CAPTURE to open the Capture app to run a Wi-Fi packet capture.
DHCP, DNS, and Gateway Results
See DHCP, DNS, and Gateway Tests.
 Target Tests
See the Test Targets topic for information on target test results.
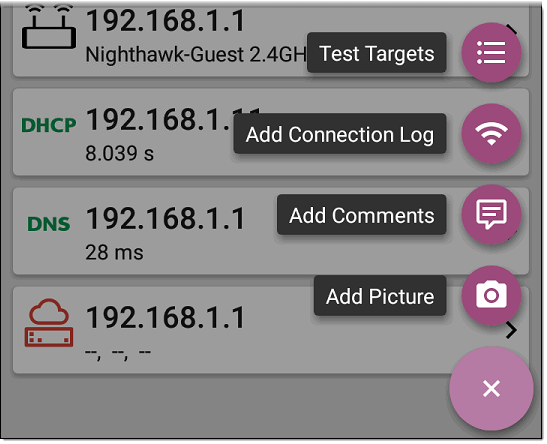
Other Actions (Wi-Fi Profile FAB)
Tap the floating action button (FAB) on the Wi-Fi Profile AutoTest Profile screen to open a floating menu for additional actions:
-
Tap Test Targets to open the Test Targets screen. You can add Ping, TCP Connect, HTTP,
-
Tap Add Connection Log to open a Link-Live upload screen that allows you to give a custom name to the log file.
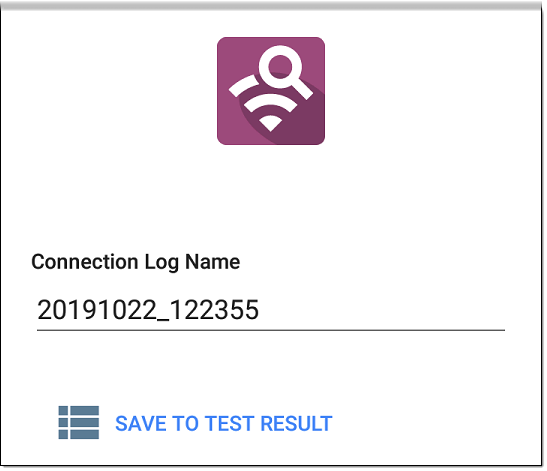
-
Use the default file name (which has a <DATE-TIME> format) or tap the text field to enter your desired log name.
-
Tap UPLOAD & ATTACH TO RESULT to upload the named log file.
-
-
Tap Add Comments to open a Link-Live upload screen where you can enter comments for the results.
-
Tap Add Picture to open the Gallery
See the Link-Live App chapter to learn more about Link-Live and uploading.