Channels Map
The Channels Map screens provide charts of channel utilization with AP coverage and overlap. Swipe right or left or tap the tab names to switch between the chart types: Map, Map 6E, or Overlap.
Map and Map 6E Tabs
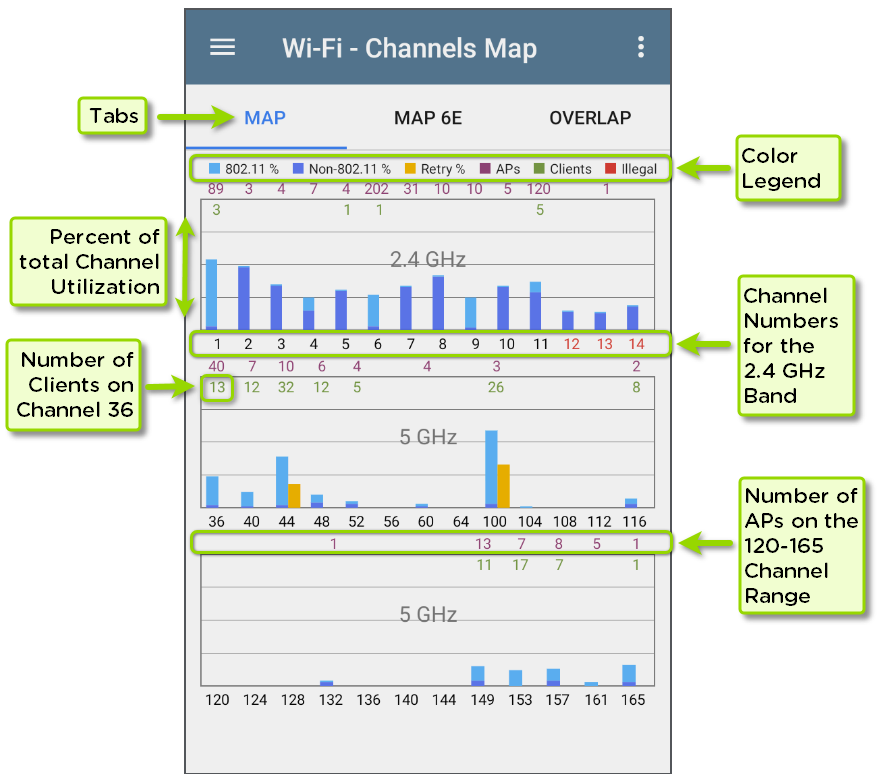
The Map and Map 6E tabs display a bar graph of 802.11 and non-802.11 utilization, retry percentage, APs for each channel, clients for each channel, and illegal channels. (The Map 6E tab is for 6 GHz channels only.)
-
Utilization - Blue vertical bars show the percentage of each channel's capacity used by 802.11 devices (light blue) and non-802.11 interference (dark blue).
-
Retries - Yellow bars next to the blue bars show the percentage of retries.
-
Channel numbers are listed on the x-axis and utilization percentage on the y-axis.
-
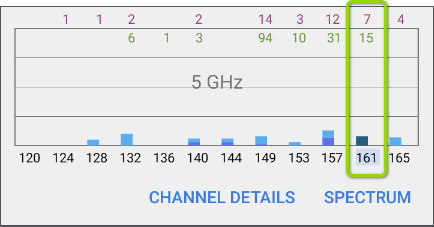
AP counts for the APs' primary channel are shown in purple at the top of the column for each channel. In the example below, Channel 161 has 7 APs. (Channels without APs can still show 802.11 utilization because of overlap from adjacent channels.)
-
Client counts for the channel are shown near the top of the column for each channel. In the example below, Channel 161 has 15 clients.
Selecting a Channel
-
Tap a Channel's column on the Map or Map 6E graph to select and highlight the channel. This displays the CHANNEL DETAILS and SPECTRUM links at the bottom of the screen. In the example below, Channel 161 is highlighted.
The Channel Details screen lets you examine the addresses and devices operating on the channel and perform a deeper analysis.
The Spectrum link opens the Spectrum app, a Wi-Fi spectrum analyzer that provides data about signal strength and noise.
Overlap Tab
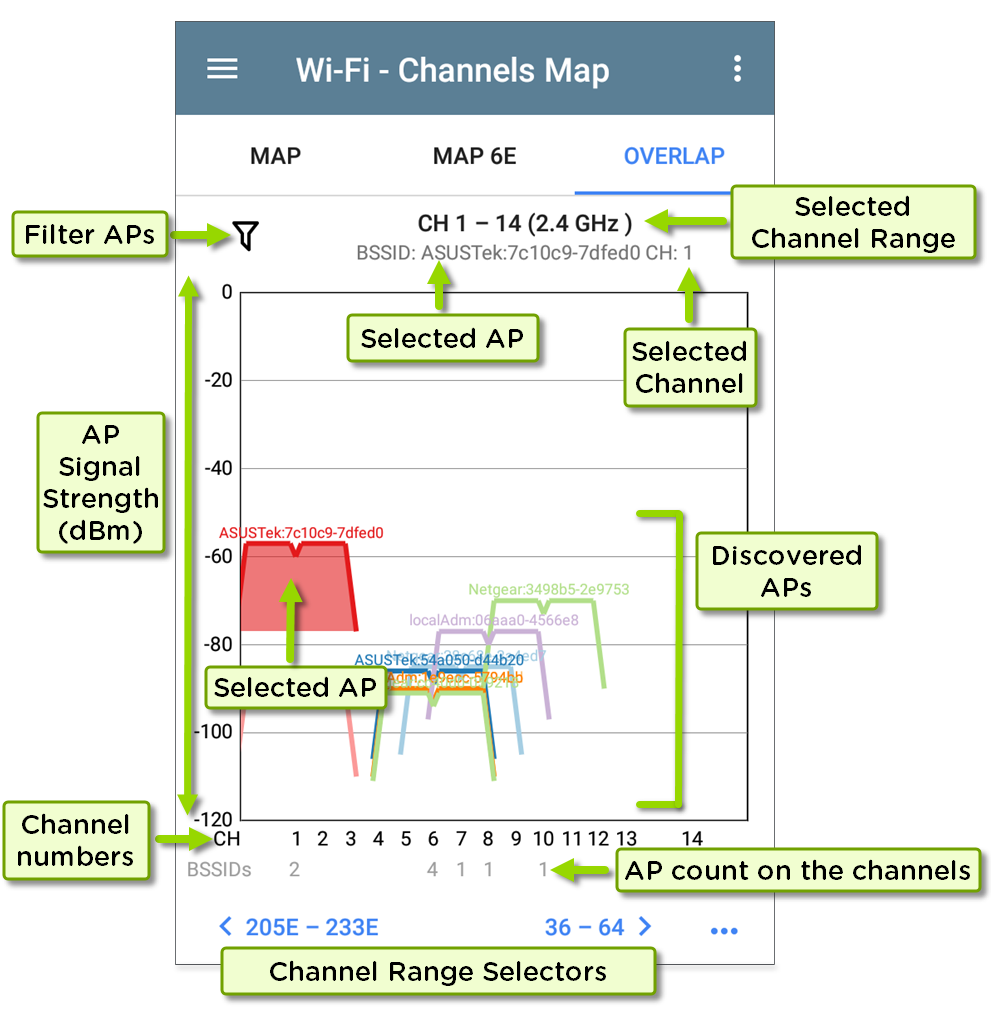
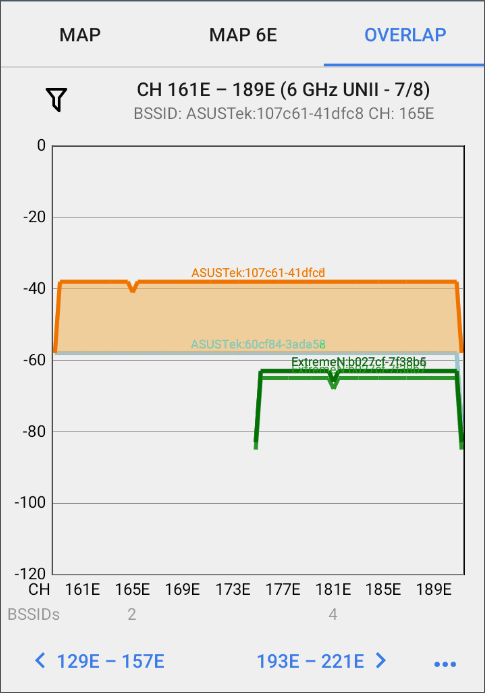
Tap Overlap to view access point channel, coverage, and overlap. This can help you spot potential coverage issues. Each discovered AP is shown as a colored bracket on a graph based on channel coverage (on the x-axis) and signal strength in dBm (on the y-axis).
-
Tap the Filter icon
 near the top left to open the Overlap Filters screen to control what APs are displayed. You can select filters for channels, SSIDs, Signal, SNR, 802.11 type, or Security.
 -
Tap an AP on the graph to select it and its primary channel. This highlights the area covered by the channel and lists the channel information above the graph. In the image below, the AP named "ASUSTek:107c61..." on channel 165E is selected.
-
Double-tap the graph to zoom in or use "pinch" gestures with your thumb and forefinger. Tap the Restore icon
 or reverse the pinch gesture to return to the full graph. The image below shows a zoomed-in view with the AP named "Cisco:f01d2d-33e300" on channel 116 selected.
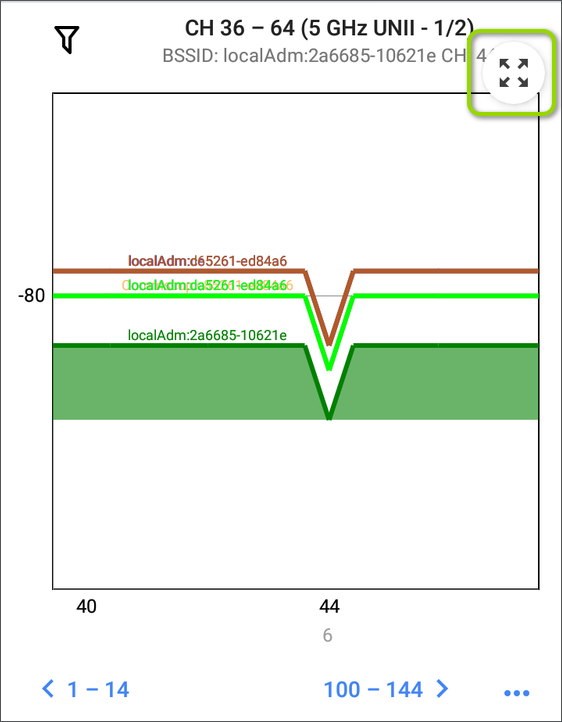
-
Tap the blue channel selectors at the bottom to view a different Wi-Fi band (2.4, 5 and 6 GHz) and channel range on the graph.
-
Tap the action overflow button
 to open the AP Details or Channel Details screens for the selected AP or Channel or to open the Spectrum App.
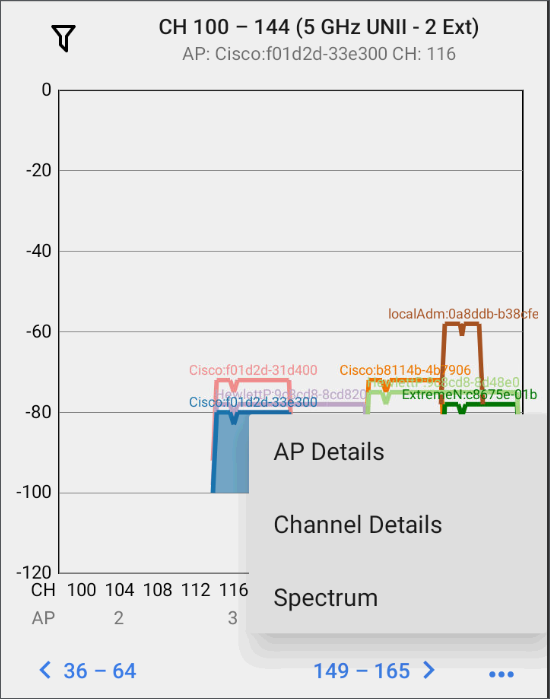
See Filtering in the Wi-Fi App for an explanation of the Overlap screen's filtering options.