Running Ping/TCP Tests
Your unit must be connected to an active network (Test or Management Port) to run Ping and TCP Connect tests. Icons in the top Status Bar indicate whether and how your EtherScope is connected. See Connection Notifications for descriptions of the connection status icons, and select the appropriate Interface (or Any Port) from the Ping/TCP settings.
The default target is google.com. Open the app settings ![]() to enter a new target.
to enter a new target.
To begin the test, tap START.
If the Number of Tests setting is set to Continuous, the Ping/TCP app runs tests to your selected target until you tap STOP.
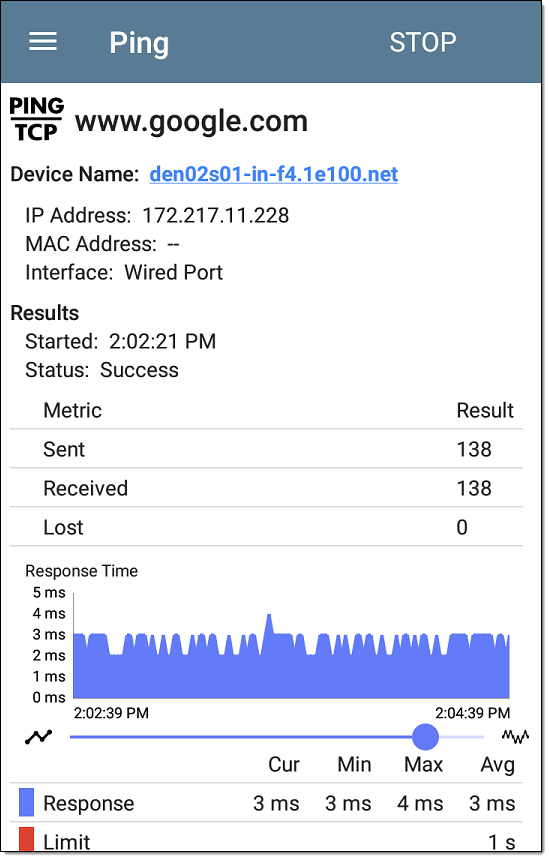
Device Name: Hostname or address of the target device
IPv4 or IPv6 Address: IP address of the target device
MAC Address: Target device's MAC address. The two dashes -- indicate that no MAC address was provided from the device.
Port: The port number used for the TCP Connect test. This field does not appear in Ping test results.
Interface: The EtherScope Test or Management Port from which the test is running
Results
- Started: Time the test started
- Status: Most recent test status
- Sent: Number of Pings or TCP SYN packets sent to the target
- Received: Number of Ping or TCP SYN/ACK packets returned from the target
- Lost: Number of Pings or TCP packets that were not returned from the target
Response Time graph: Plots the target device's response times in milliseconds. The graph saves and displays data for up to 24 hours in the past if the unit stays linked.
To pan and zoom on the graph, you can swipe, double tap, and move the slider. See the Trending Graphs topic for an overview of the graph controls.
Response: Table display of the Current, Minimum, Maximum, and Average response time measurements
Limit: The Timeout Threshold from the Ping/TCP app's settings