 Results
The Results page in Link-Live displays test results uploaded from NetAlly testers. The page is split into a list panel on the left and a detail panel on the right.
In the image below, a LANBERT test, uploaded from an EtherScope nXG with an SFP module, is selected, and wired fiber LAN details are shown in cards on the right. The selected test result has a Label, "Site B," and is part of an Album called "Documentation."
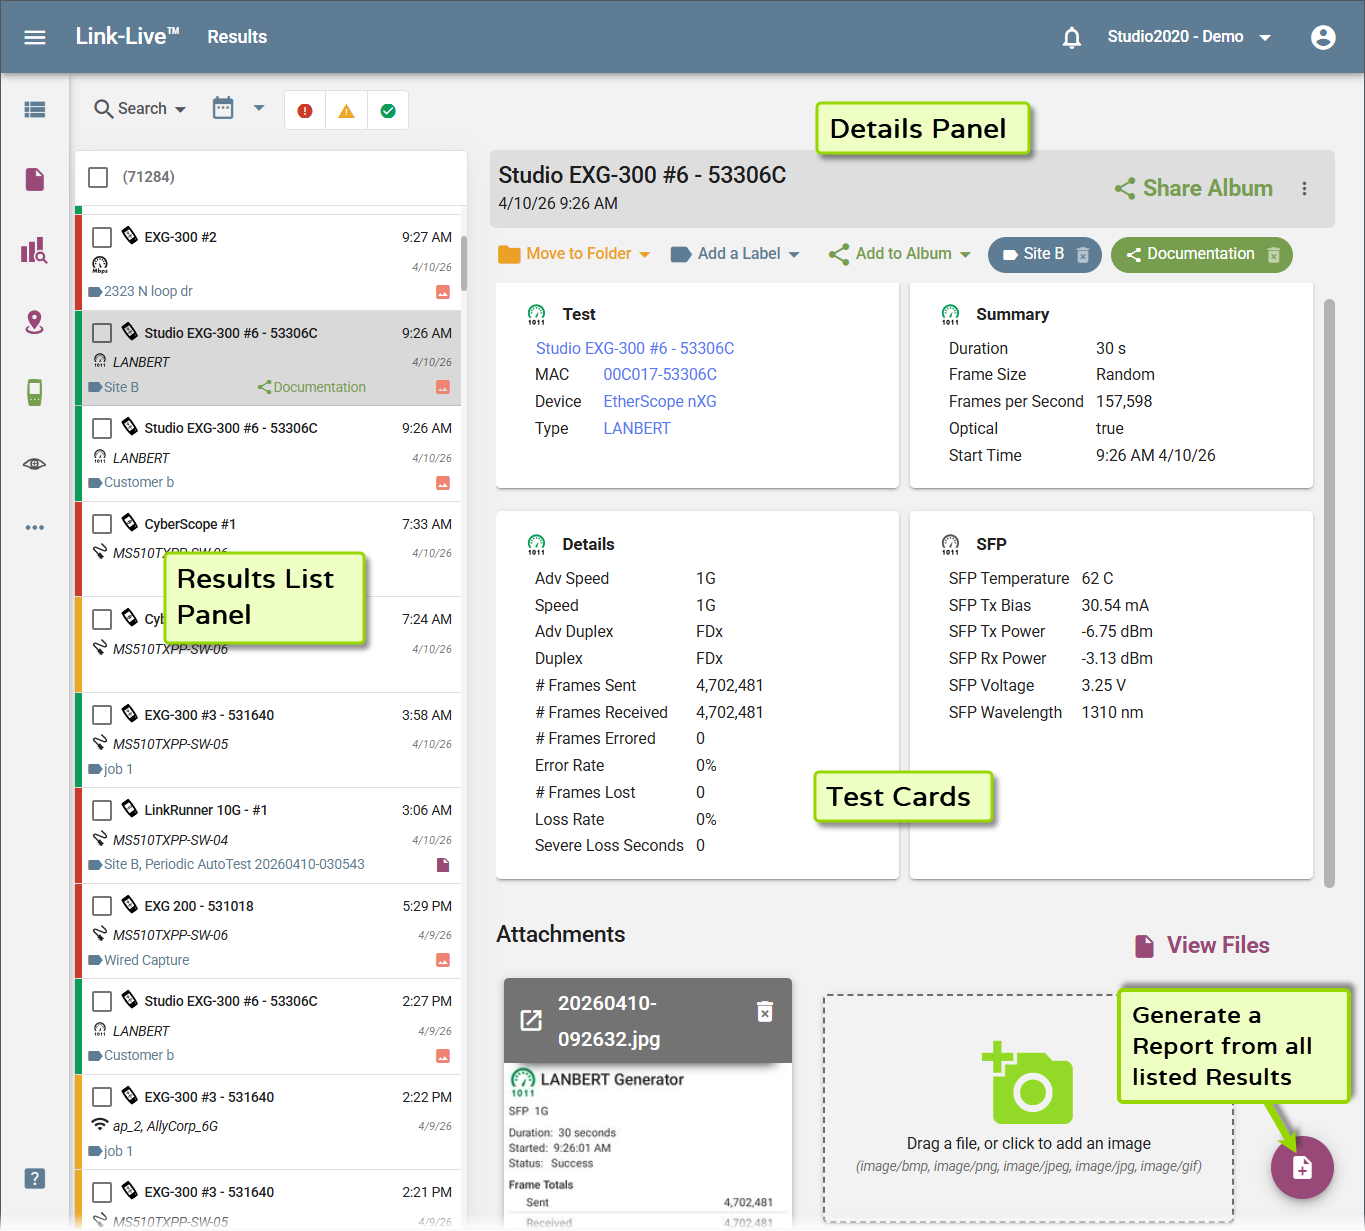
Results List and Details Panel
The list panel shows all results for your organization. The count at the top of the list shows how many results are currently displayed out of the total (for example, "1987 of 71327" when a filter is active).
Each entry in the list shows the unit name, test type, date and time, and any applied tags. Click a result to view its corresponding data in the detail panel, including the result name, date and time, a toolbar with actions, and test data organized into cards. The cards displayed depend on the test type.
Filtering and Searching Results
Use the search and filter bar above the list to narrow results by name, unit, date, or other criteria.
The status filter icons in the search bar let you filter results by AutoTest outcome:
-
 – failed results
 -
 – results with warnings
 -
 – passed results
Labels and Folders

At the top of the detail panel, a toolbar shows actions and any tags applied to the result. Three types of tags can be applied, each displayed in a distinct color:
-
Folders (orange) – Indicates the folder the result lives in.
-
Labels (blue) – User-defined labels for categorization. Click Add a Label to apply one. Multiple labels can be applied to a single result.
-
Albums (green) – Click Add to Album to view existing albums or create a new one.
Click the trashcan icon on any tag to remove it. Tags also appear on the result's entry in the list panel.
In the top-right corner of the detail panel, the Share Album button is available when the result has been added to an album. Click it to generate a shareable link. An overflow menu (⋮) next to it provides additional options. See Labels, Folders, and Albums for details on sharing options.
Test Data Cards
Test data is displayed in cards below the toolbar. The cards shown depend on the test type. Common cards include:
-
Test – Always present. Shows the unit name, MAC address, device model, and test type.
-
Link – Wired link details: speed, advertised speed, duplex, RX pair, optical setting, and configured speed.
-
VLANs – Unit VLAN ID, VLAN priority, number of VLANs seen, and the list of discovered VLAN IDs (including Untagged).
-
802.11 Switch – Connected switch details discovered via LLDP or CDP: MAC address, model, IP, profile, VLANs, protocol type, and port description.
-
Summary – High-level test summary values such as duration, frame size, frames per second, optical setting, and start time (shown for traffic tests such as LANBERT).
-
Details – Detailed traffic statistics: advertised speed, speed, duplex, frames sent, frames received, frames errored, error rate, frames lost, loss rate, and severe loss seconds.
-
SFP – Optical transceiver data: temperature, TX bias, TX power, RX power, voltage, and wavelength (shown when an SFP module is in use).
Attachments
Below the test data cards, the Attachments section displays image files associated with the result. You can add images to a result by dragging them into the drop zone or clicking to browse. Supported formats are BMP, PNG, JPEG, JPG, and GIF.
Click View Files to open the associated files in the Files section.
Generating Reports from Results
To generate a report from the Results page, click or tap the floating action button and select the type of report you want to generate. The report includes ALL results displayed in the list panel matching the current filter criteria—not just the selected result. Note that generating a report for a large number of results may take significant time. See the Reports topic for details.