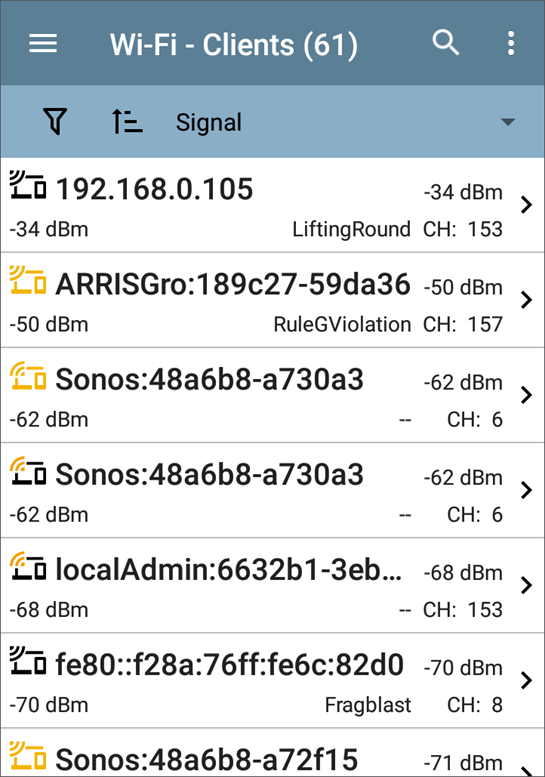
Clients
The Clients list screen displays the wireless clients the EtherScope has discovered connected to your wireless networks.
You can Filter  and Sort
  the list to determine which Clients are shown and their order. Refer to the Wi-Fi App List Screens topic if needed.
By default, the Clients are ordered by Signal strength, and each card shows the client's Signal strength in dBm, the SSID of the network to which the client is connected, and the channel number on which the Client is operating.
The general Client icons indicate whether the device is Probing  or Connected
  to a network and able to receive data. If a Client is probing, two dashes -- display where the SSID would appear.
The Clients screen also shows specific icons for NetAlly testers, like the EtherScope icon  shown in the image above.
Tap a Client's card to open the Details screen.
Client Details
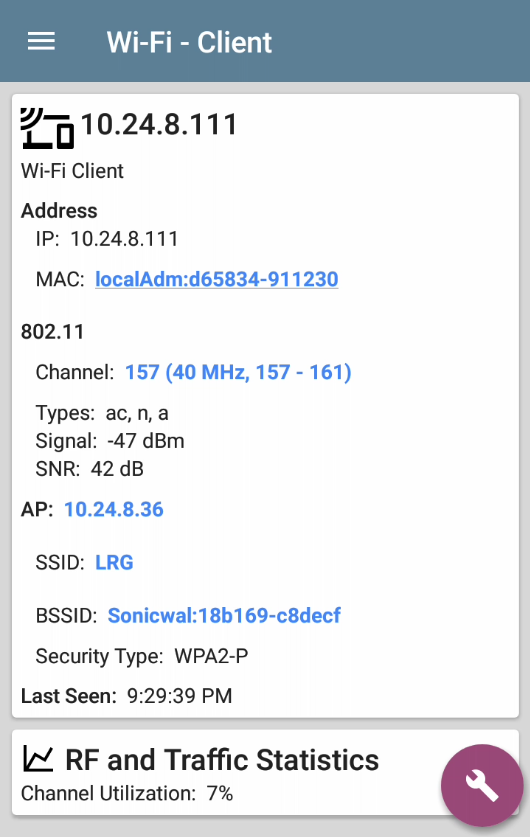
The top Client Details card for a connected Client displays the following information:
- Client's IP and MAC addresses.
- User-assigned Authorization status (if set)
- Supported 802.11 media Types
- Signal-to-Noise ratio (SNR) measurement
- Name of the AP to which the Client is connected
- SSID of the network to which the Client is connected
- BSSID on which the Client is operating
- Network Security type
- Time the Client was Last Seen by the EtherScope
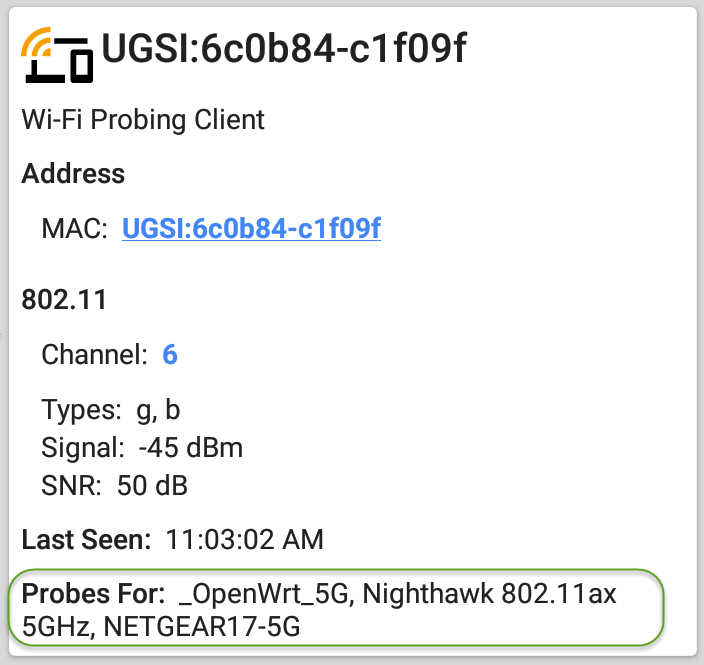
Probing Clients
If the client is a Wi-Fi probing client, the details screen replaces AP details with a list of the SSIDs for which the client is probing in the Probes For field:
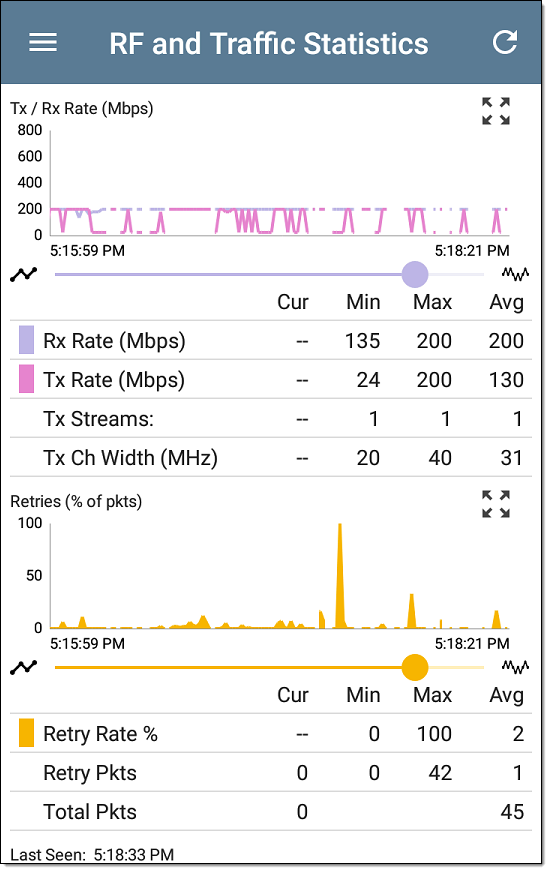
Client RF and Traffic Statistics
Tap the RF and Traffic Statistics card to open the RF and Traffic Statistics screen. This screen displays the client's ID or address and channel number at the top of the screen as well as informational graphs.
To pan and zoom on the graphs, you can swipe, double tap, and move the slider under each graph. Tap the Restore icon  to return to the full graph. (See the Trending Graphs topic for an overview of the graph controls.)
See RF and Traffic Statistics Overview in the Wi-Fi Details Screens topic for an explanation of the common elements of this screen.
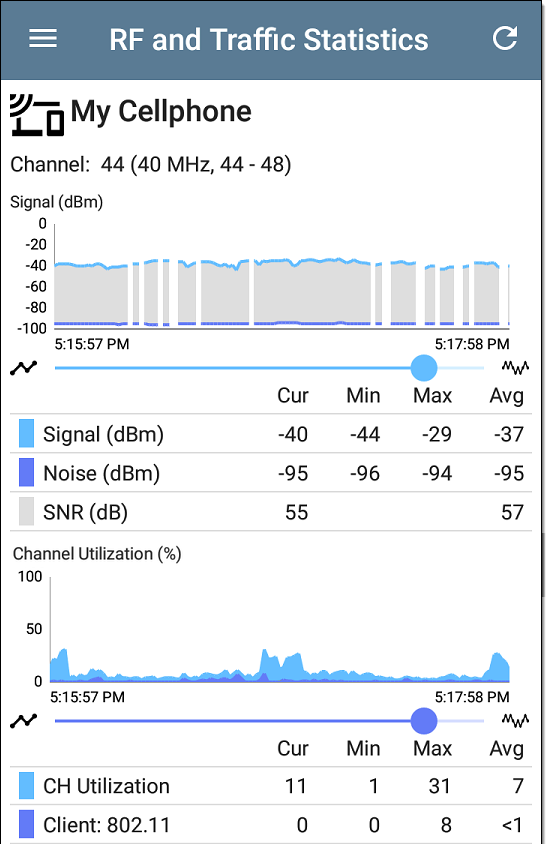
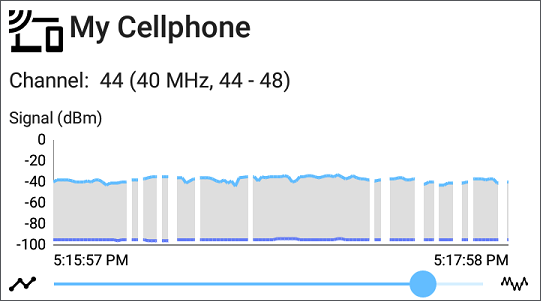
The Signal graph shows the signal in light blue, noise in dark blue, and a calculated SNR.
The Channel Utilization graph uses light blue to show 802.11 channel utilization and dark blue to show non-802.11 utilization:
Breaks in the Client RF and Traffic graphs may occur if the Client is not consistently transmitting, so there is no data for EtherScope to display during those times.
The Clients RF and Traffic Statistics screen also displays a graph of Transmit (Tx) and Receive (Rx) Rates in Mbps, number of Tx Streams, and Tx Channel Width in MHz.
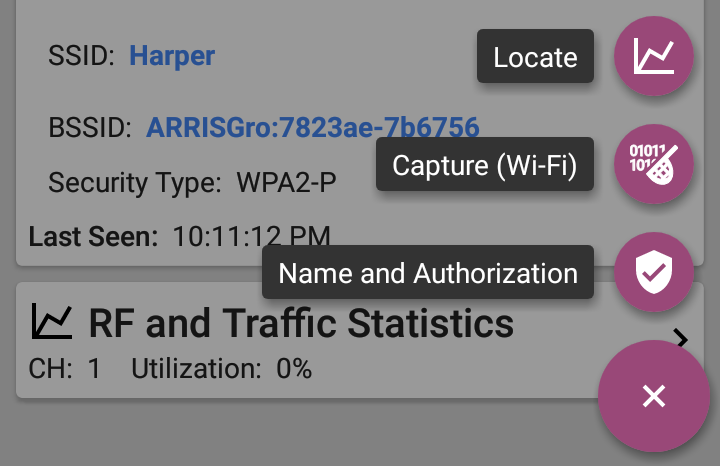
Clients FAB
Tap the FAB on the Client Details screen to Locate the client device, to open the Capture app to record a packet capture of traffic going to and from the client, or to assign or change its Name and Authorization.
-
Select Locate to open the Locate Client screen. See Locating Wi-Fi Devices.
-
Select Capture to open the Capture app populated with the Channel and MAC address of the client. See the Capture app chapter.
-
Select Name and Authorization to open the Name and Authorization dialog. See Assigning a Name and Authorization to a Device.