 Monitoring
The Monitoring section of Link-Live displays the results of Discovery Monitoring sessions collected by NetAlly testers. Discovery Monitoring configures a tester to periodically collect network discovery snapshots and upload them to Link-Live, where you can establish a baseline and track changes in your network over time, detecting new devices, missing infrastructure, or configuration changes between snapshots.
Setting Up Discovery Monitoring
Discovery Monitoring is configured on the tester interface. To enable it, open the Discovery Monitoring settings (shown below) in the Discovery app on your tester and toggle the Discovery Monitoring switch.
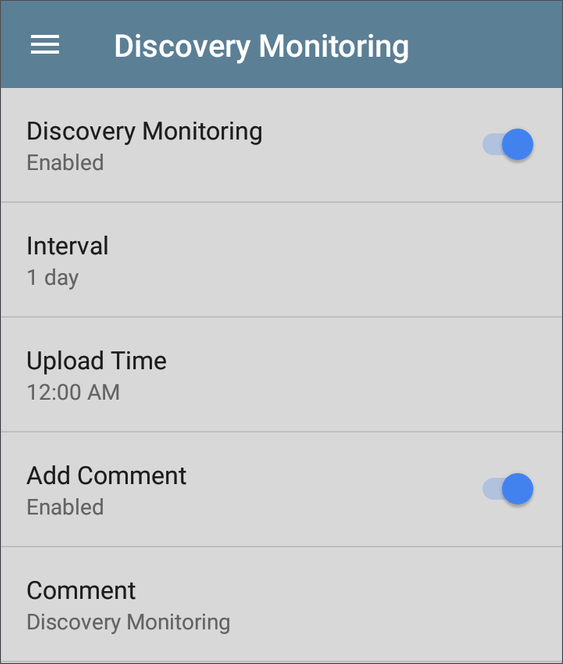
Once enabled, the following settings are available:
-
Interval – How often the tester collects a new discovery snapshot, in days or a custom time frame.
-
Upload Time – The time of day the snapshot is sent to Link-Live.
-
Comment – An optional label for documenting the monitoring activity when it's uploaded to Link-Live.
See your tester's user guide for full setup instructions.
Viewing Monitoring Results in Link-Live
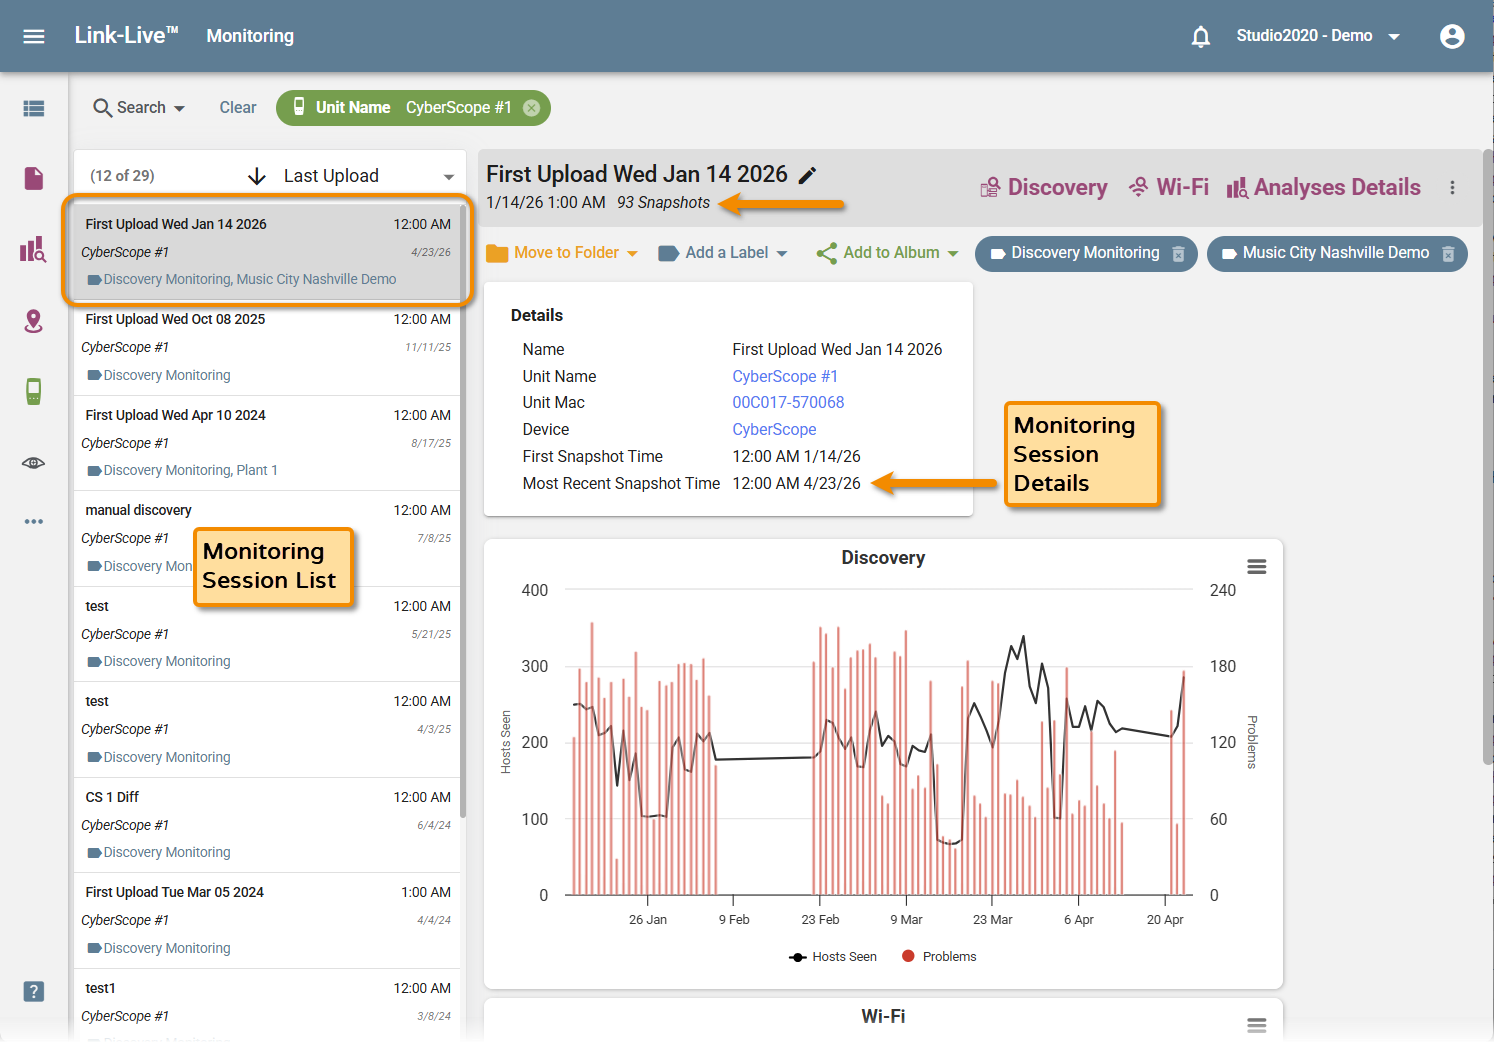
Each session in the Monitoring list represents a series of periodic network discovery snapshots from a single tester. Click a session to view its details, labels, and graphs in the detail panel.
Monitoring Detail Panel
Sessions are named after the date of the first upload by default (for example, "First Upload Wed Jan 14 2026") but can be renamed by clicking the pencil icon. The header also shows the date and time of the first snapshot and the total number of snapshots in the session. The Details card shows:
- Name
- Unit Name, Unit Mac, and Device (each a hyperlink to filter the list by that value)
- First Snapshot Time
- Most Recent Snapshot Time
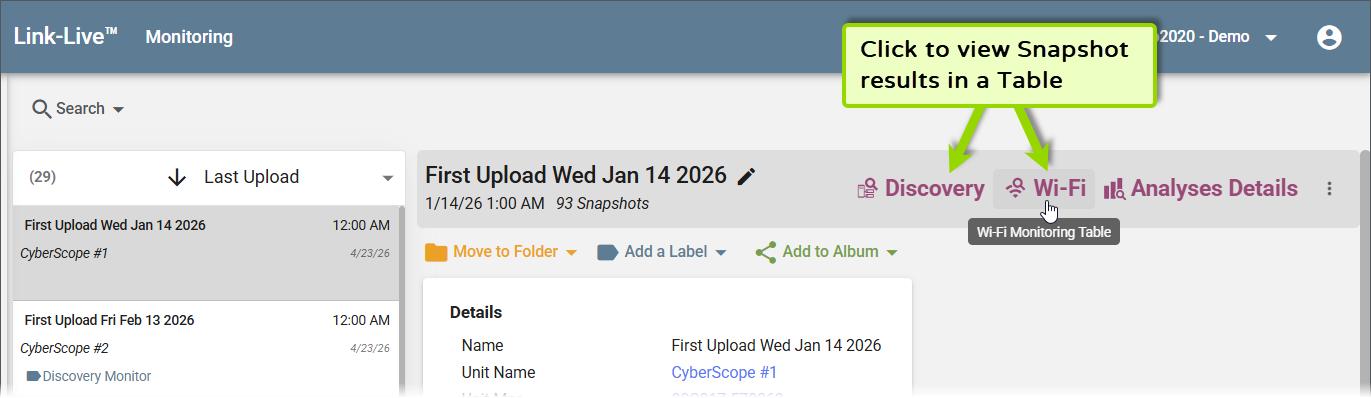
The Discovery, Wi-Fi, and Analyses Details buttons above the detail panel provide three ways to drill into snapshot data:
-
Discovery or Wi-Fi – Opens a summary table of all snapshots for that analysis type within the session.
-
Analyses Details – Opens a list of all individual snapshots in the session, similar to the main Analysis list page. Selecting a snapshot shows its Analysis Info and overview charts in the detail panel, with Discovery and Wi-Fi buttons to open the full analysis view for that snapshot.
Monitoring Session Graphs
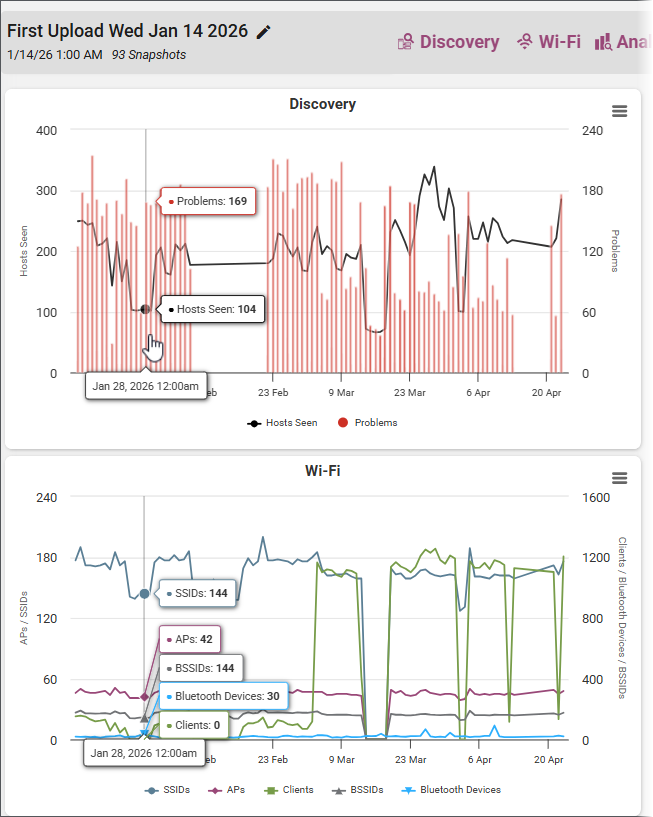
Below the Details card, trend charts display how key metrics have changed across snapshots over time:
-
Discovery – Line chart of Hosts Seen (left axis) and bar chart of Problems (right axis).
-
Wi-Fi – Line charts of SSIDs, APs, BSSIDs, Clients, and Bluetooth Devices over time.
NOTE: Wi-Fi monitoring data (including the Wi-Fi chart and Wi-Fi table view) is only available when Wi-Fi data was collected and uploaded from the tester.
Hover over any point in a chart to see the data values recorded at that snapshot.
To navigate to a specific snapshot from the trend charts, click a data point. A pop-up shows the snapshot date with two options:
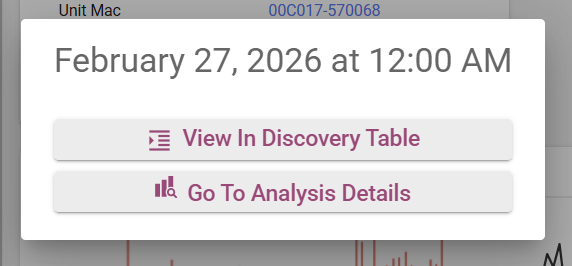
-
View In Discovery Table – Opens the snapshot in the Discovery Table view.
-
Go To Analysis Details – Navigates to the Analysis Details page for that snapshot.
Discovery Monitoring Table
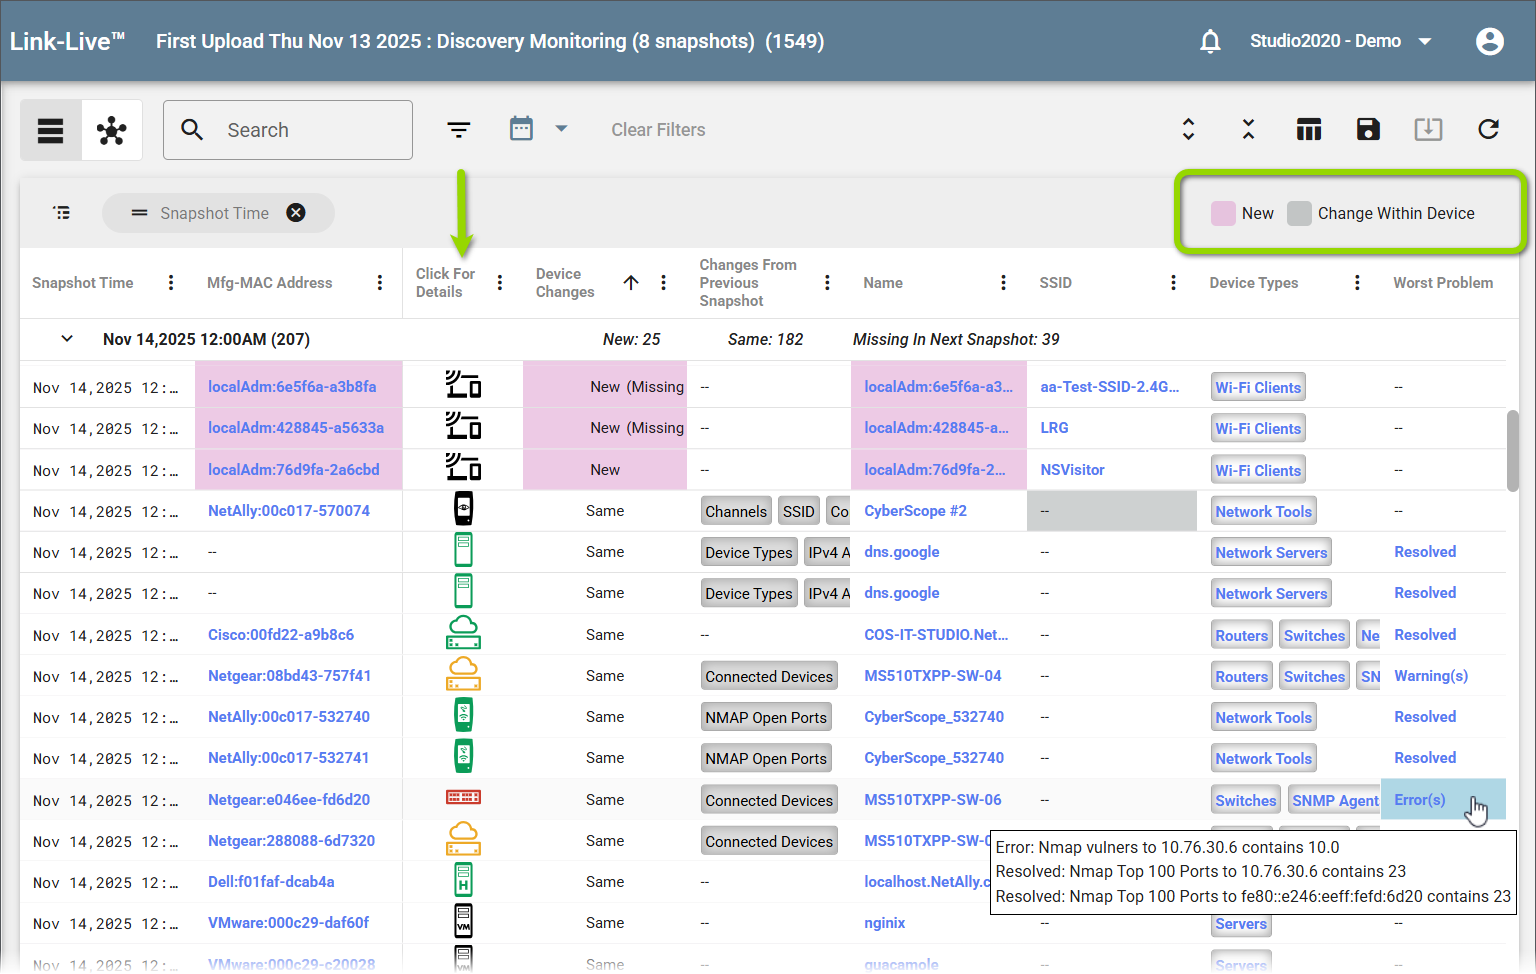
The Discovery Monitoring Table groups rows by snapshot date and time, with each group expandable to show the individual devices discovered in that snapshot. The snapshot-level rows summarize device counts, including how many devices were New or the same as the previous snapshot, and how many were missing in the next.
-
Expanded device rows show the Device Changes column, where any properties that changed since the previous snapshot appear (such as Channels, SSID, or Connected Devices).
-
New devices are highlighted in pink and devices with changes are highlighted in gray, as shown in the legend in the upper right.
-
Click an icon in the Click for Details column to open a pop-up with device and connection details.
-
Mfg-MAC Address, Name, and other values are also hyperlinked to apply filters to the view.
-
The Worst Problem column shows Error(s) or Warning(s) for each device; hover over a value to see the full error or warning text.
Discovery Monitoring Topology View
As in the Discovery Analysis section of Link-Live, you can review discovery monitoring snapshots as a Topology view. In Monitoring, the Topology view supports comparing two snapshots to detect network changes over time.
To access, open the Discovery Monitoring Table (click Discovery above the monitoring session detail panel) and click the Topology icon in the top toolbar.
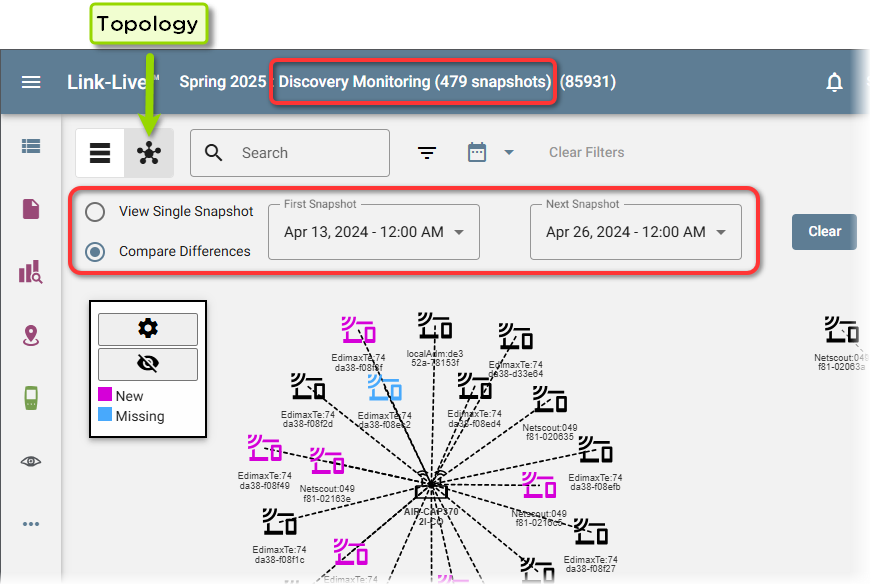
Use the options at the top of the Topology view to switch between modes:
-
View Single Snapshot – Displays the network topology at a single selected date and time.
-
Compare Differences – Select two date/time ranges to highlight what changed in the network topology between the two sessions.
Analyses Details
Clicking the Analyses Details button for a monitoring session opens the list page that shows the individual snapshots in the session.
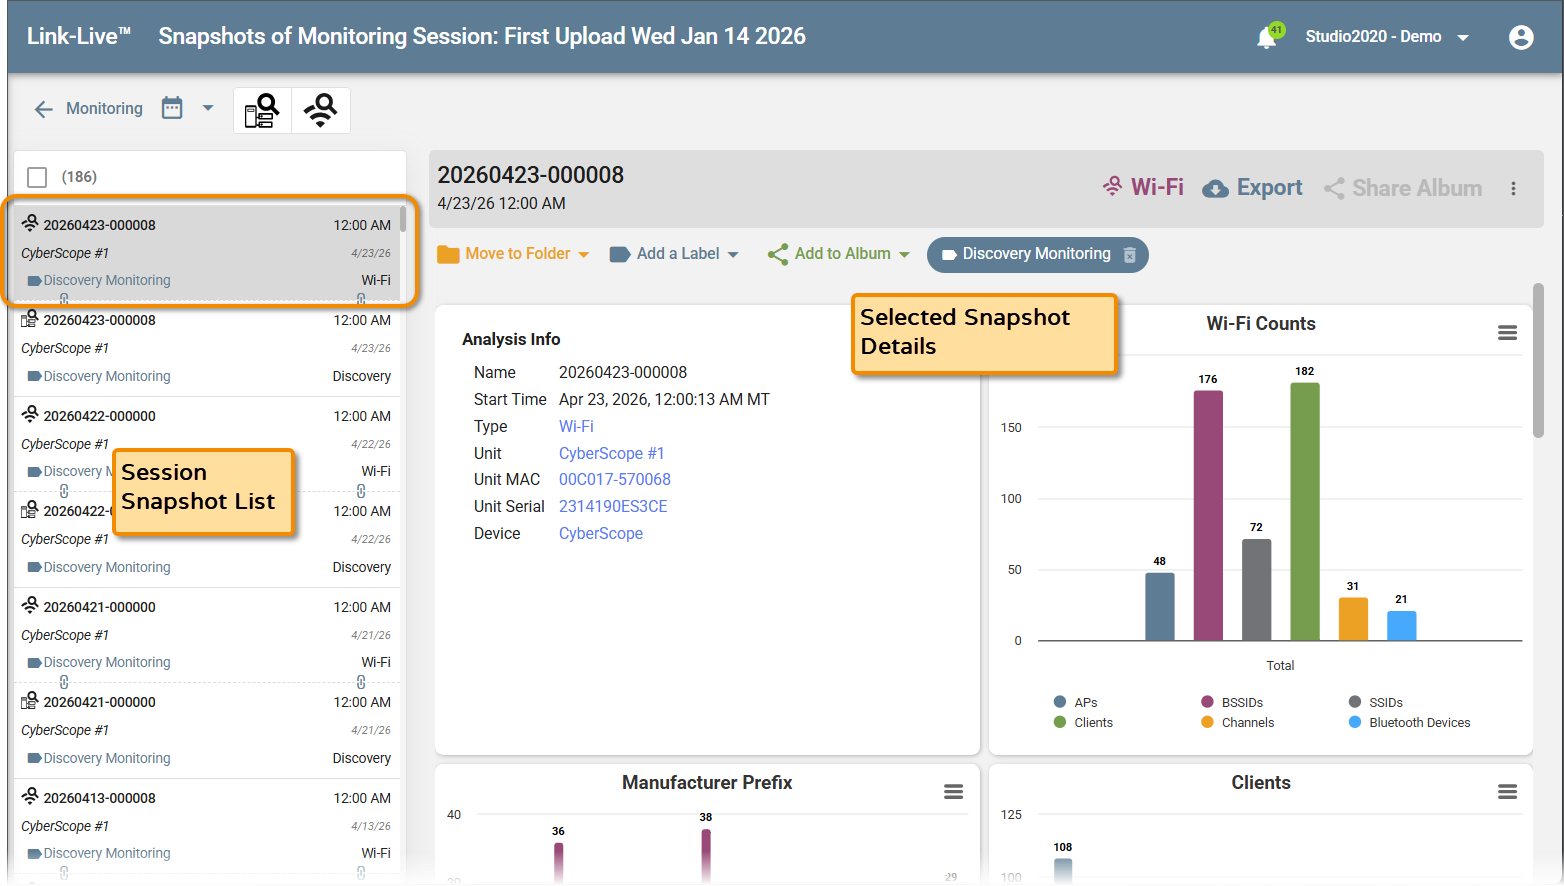
Snapshots are named by date (for example, "20260423-000008"). Each entry in the Session Snapshot List shows the snapshot name, unit, date, label, and analysis type (Discovery or Wi-Fi).
The Selected Snapshot Details panel shows an Analysis Info card with the snapshot name, start time, type, unit, unit MAC, unit serial, and device, along with overview charts for the snapshot. Click Wi-Fi or Discovery to open the full analysis view for the selected snapshot. Use the ← Monitoring back button to return to the main Monitoring list.