Discovery Analysis
Discovery Analysis in Link-Live displays network discovery data collected by compatible NetAlly testers. Use Discovery Analysis to visualize discovered devices, review network details, and identify topology and potential problems. Discovery Analysis results appear in the Analysis list alongside Wi-Fi and Path Analysis results. See Analysis for information on accessing and navigating the list.
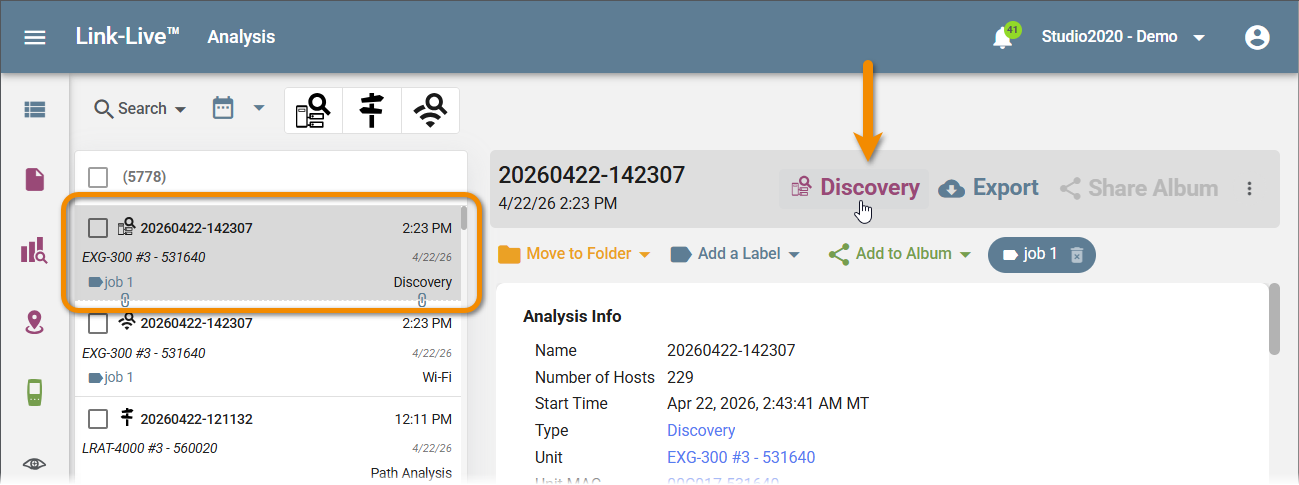
To open the dedicated Discovery Analysis Views, click the Discovery button on the Analysis list page with the analysis you want to examine selected.
Discovery Analysis Views
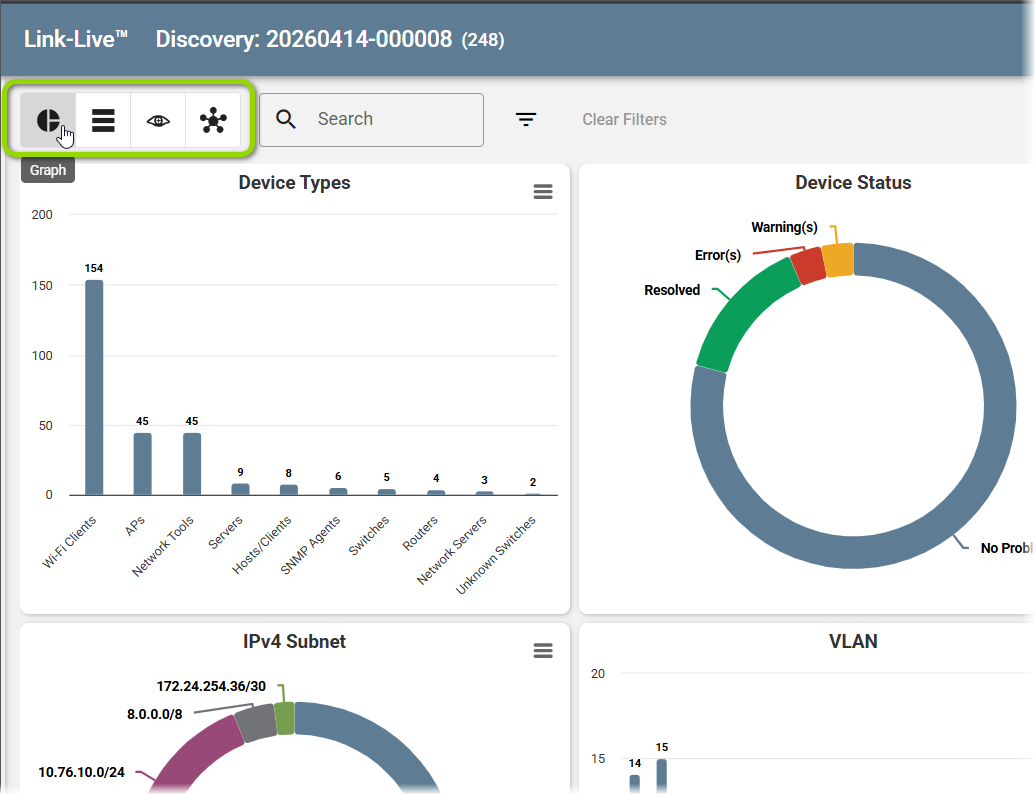
When you open a Discovery Analysis result, the toolbar at the top provides access to Graph, Details, and Topology views. A Ports view also appears when the analysis includes Nmap data. The number of discovered hosts is shown in the header.
Graph View
The Graph view displays a summary of the discovery data as a set of charts, including the following:
-
Device Types – Bar chart of discovered device categories.
-
Device Status – Donut chart showing counts of Resolved, Warning, and Error devices.
-
Authorization Class – Donut chart showing Authorized, Unauthorized, and Unclassified devices.
-
IPv4 Subnet – Donut chart of discovered subnets.
-
VLAN – Bar chart of discovered VLANs.
-
SSIDs – Bar chart of discovered wireless networks.
-
Channel Usage – Bar chart of Wi-Fi channel utilization.
-
Security Types – Bar chart of wireless security types in use.
-
802.11 Types – Bar chart of 802.11 protocol types.
-
Band – Donut chart of 2.4 GHz vs. 5 GHz device distribution.
Other graph types may appear when other data is available.
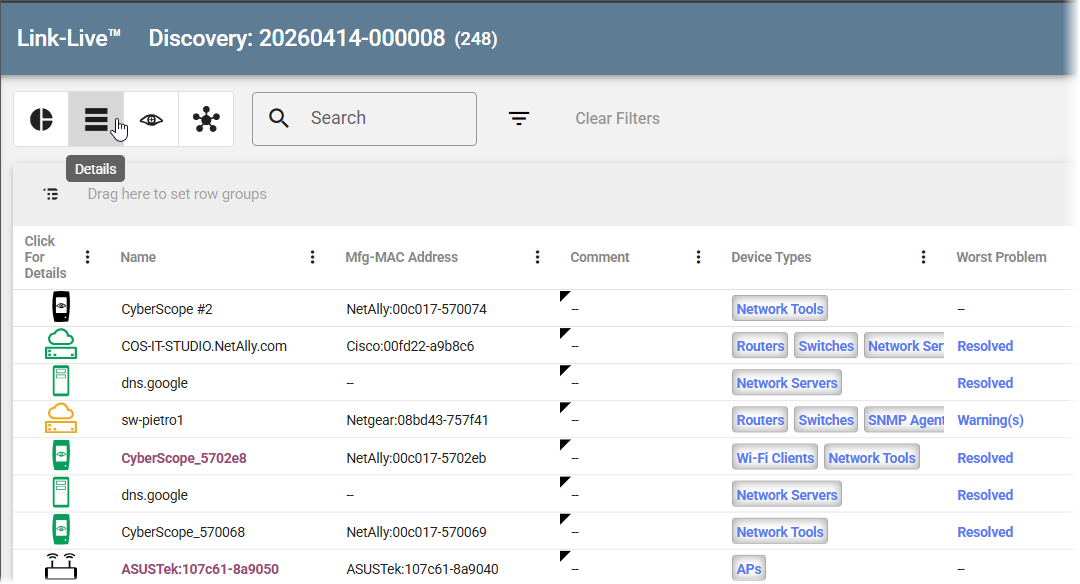
Details Table
The Details Table view displays discovered devices in a table with the following columns:
-
Name – Device hostname or identifier.
-
Mfg MAC Address – Manufacturer and MAC address.
-
Comment – User-added notes.
-
Device Types – Device category tags (e.g., Network Tools, Workstations, Managed).
-
Worst Problem – The highest-severity problem found for the device, shown as a colored severity tag.
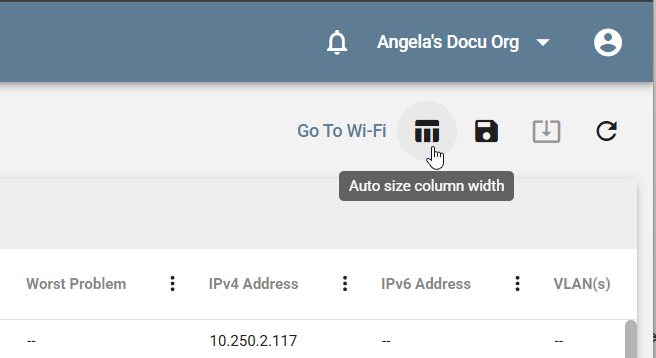
The table toolbar provides the following controls:
-
Go To Wi-Fi – Opens the associated Wi-Fi analysis for the same discovery session, if available.
-
Auto size column width – Resizes all columns to fit their content.
-
Save Table State to Org – Saves the current column arrangement and sort order for your organization.
-
Export – Downloads the table data as a CSV file.
-
Reset columns to their default layout – Resets all column settings to default.
Click a column header to sort the table by that column. Drag a column header to reorder columns.
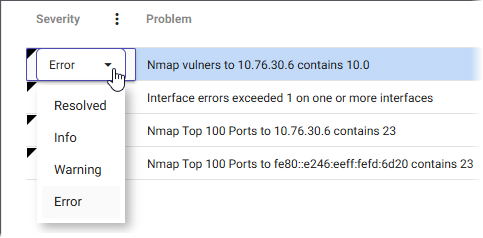
Problem Severity
Each problem in the Details table has an associated severity level. You can change the severity of a problem using the dropdown in the Severity column. Available levels are:
- Resolved
- Info
- Warning
- Error
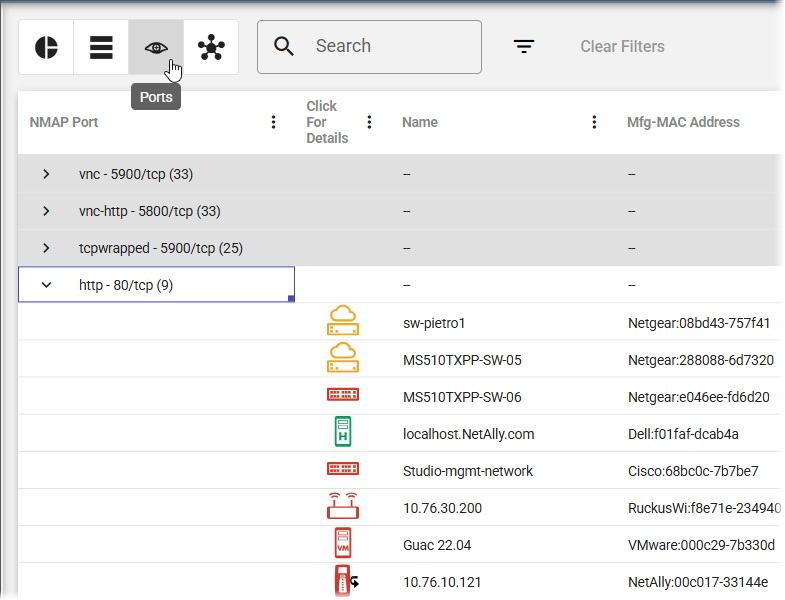
Grouping by Nmap Port
In the Ports view, results are grouped by Nmap port to show which devices have specific ports open. Each group shows the port/protocol and the number of matching devices.
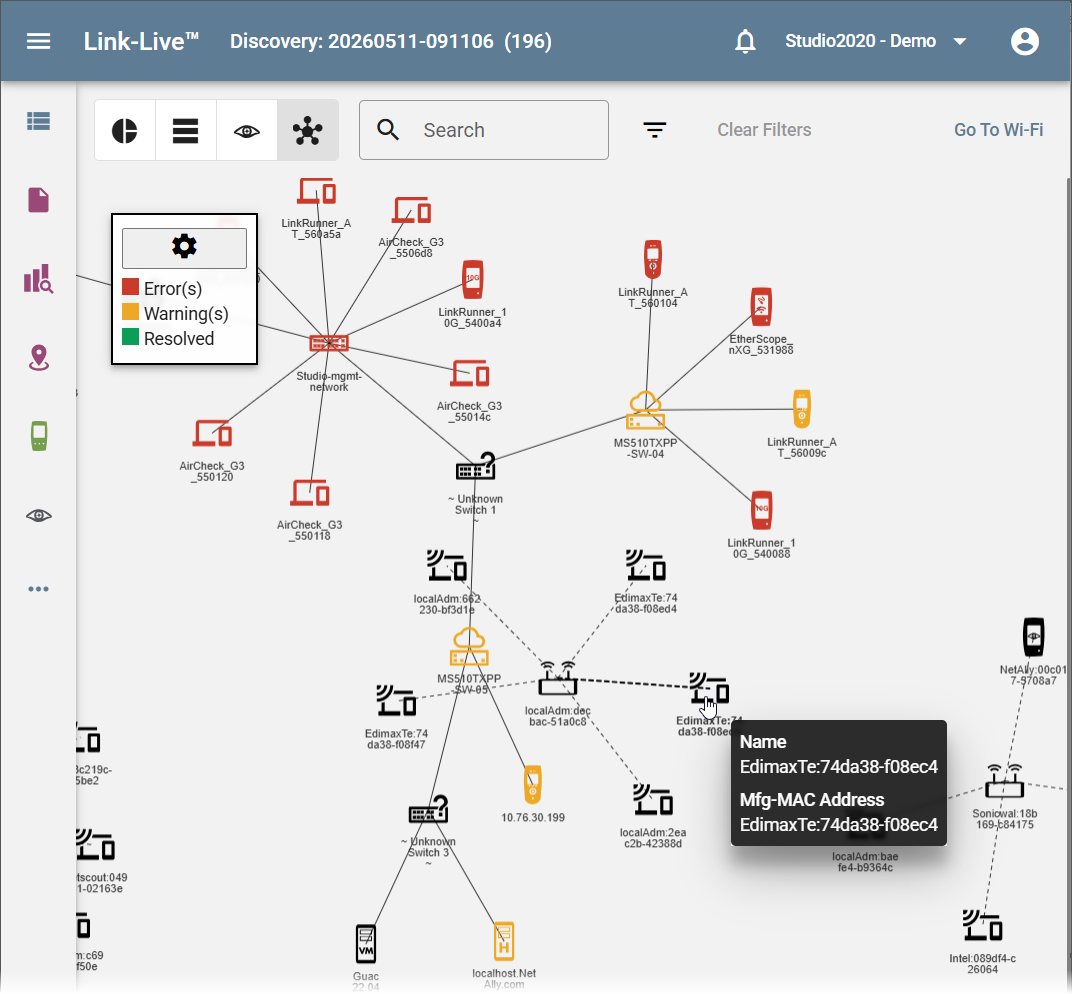
Topology View
NOTE: Full Topology Mapping, including advanced map controls, filtering, and reporting, requires an active AllyCare subscription.
The Topology view displays a visual map of the discovered network, with devices shown as icons connected by lines representing network relationships. Nodes are color-coded by status:
-
Red – Error
-
Orange – Warning
-
Green – Resolved
If available, you can navigate to the connected Wi-Fi analysis with the Go To Wi-Fi button.
To compare topology across Discovery Monitoring snapshots, see Monitoring.
Filtering Discovery Data
Use the search bar and filter controls to narrow the data shown in any view. Filters are persistent: they remain active when switching between Graph, Details, and Topology views. Click Clear Filters to remove all active filters. See Searching and Filtering.
Views, Templates, and Reports
Discovery Analysis supports Views and Templates for saving and reusing display configurations, and can generate reports. See Views and Templates and Reports for details.