 Wi-Fi Analysis
Wi-Fi Analysis in Link-Live displays wireless network data collected by compatible NetAlly testers. Use Wi-Fi Analysis to review channel utilization, access point details, client connections, and other wireless metrics. Wi-Fi Analysis results appear in the Analysis list alongside Discovery and Path Analysis results. See Analysis for information on accessing and navigating the list.
To open the dedicated Wi-Fi Analysis Views, click the Wi-Fi button on the Analysis list page:
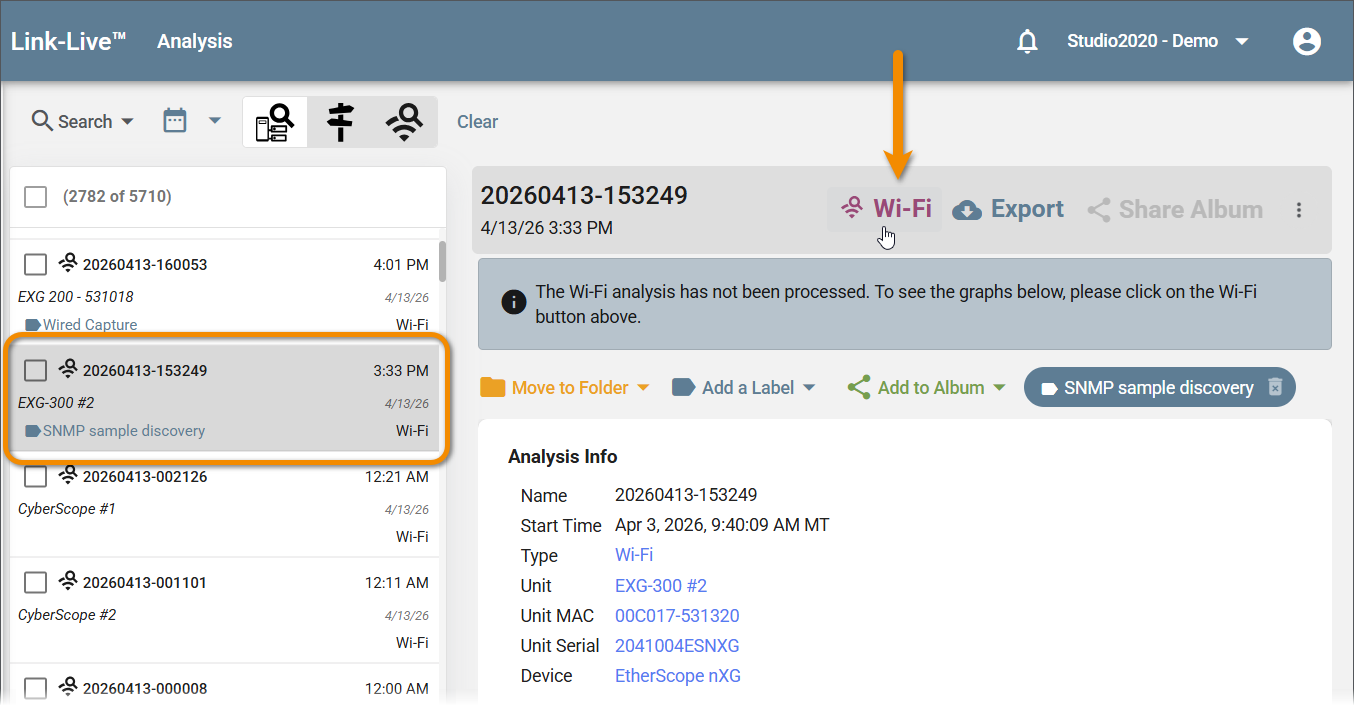
If the result has not yet been processed, a message appears. Click Wi-Fi to process it and display the data.
Wi-Fi Analysis Details Table
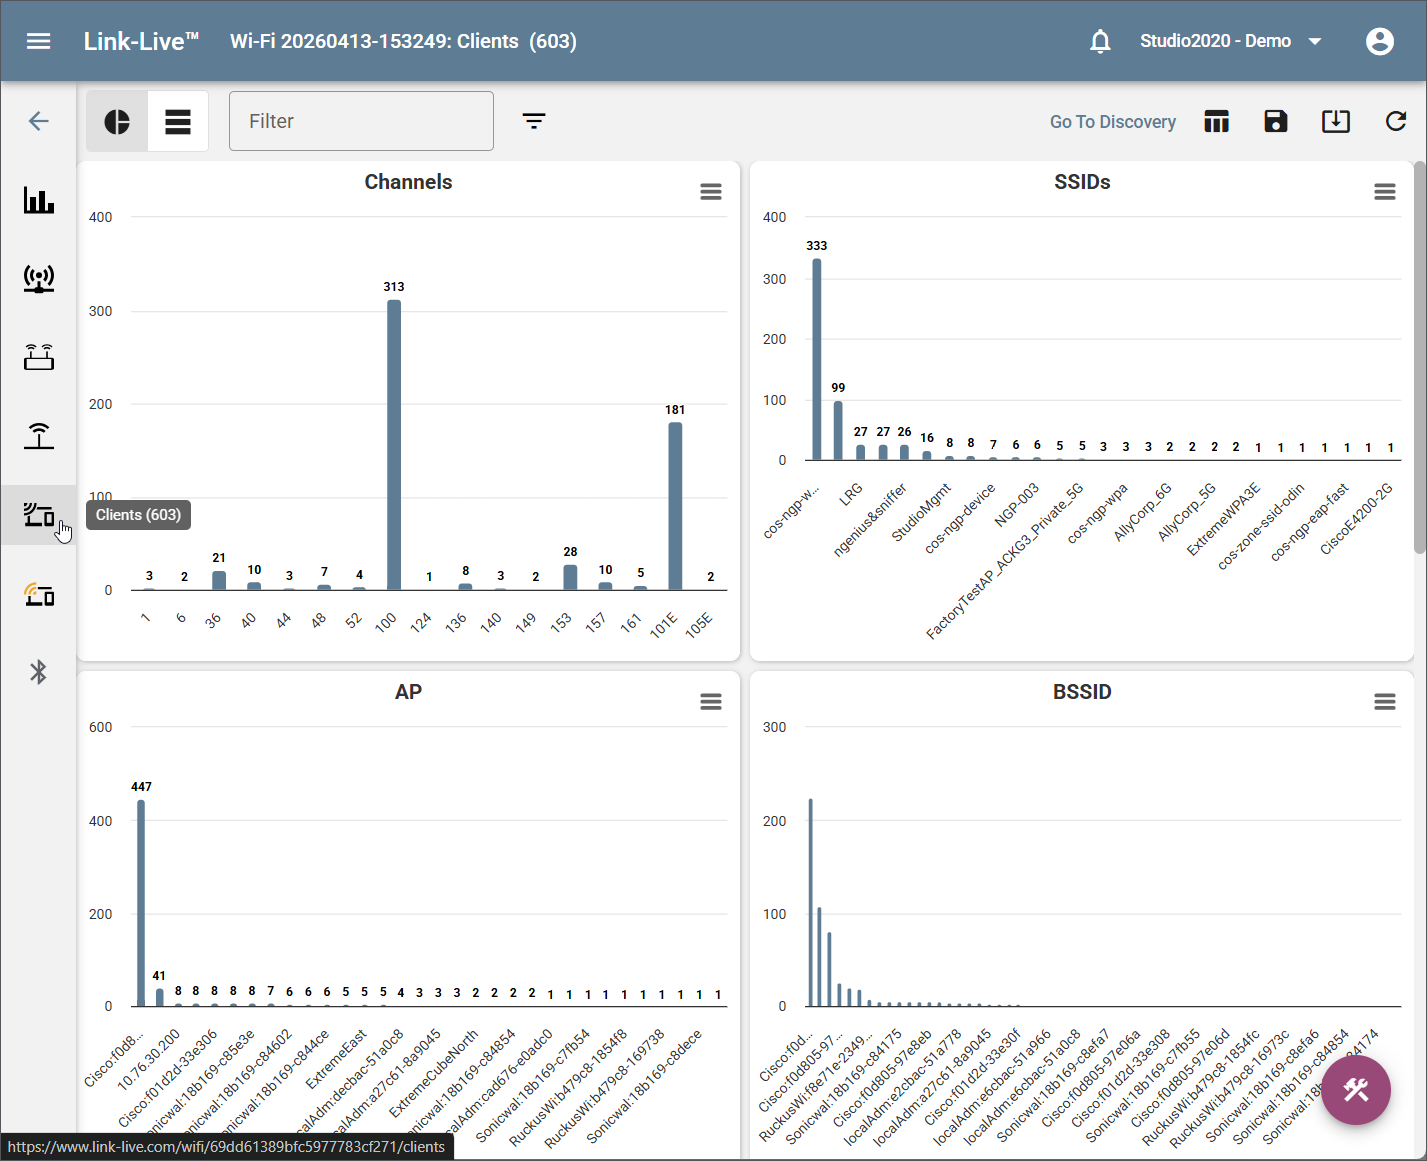
Opening a Wi-Fi Analysis result first displays a table view of channels in use during the analysis.
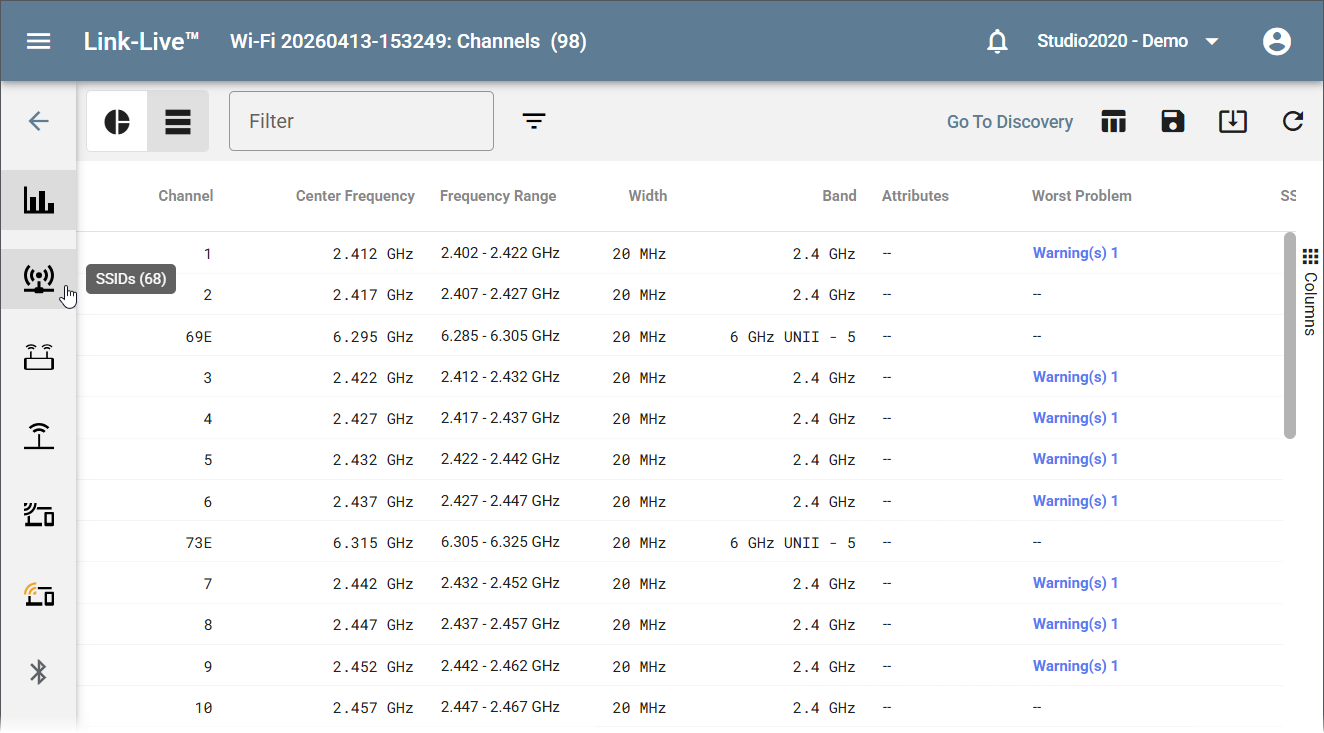
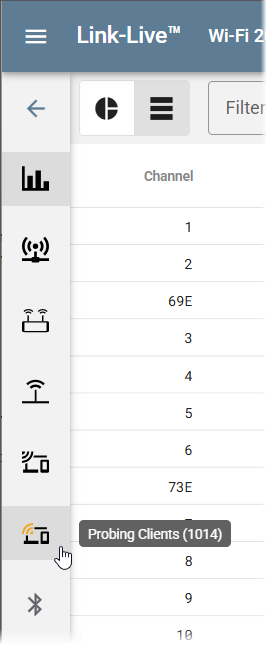
The left sidebar becomes a selection menu for additional table views: SSIDs, access points, BSSIDs, clients, probing clients, and Bluetooth devices.
Toggle between table and graph layout using the icons in the top left toolbar.
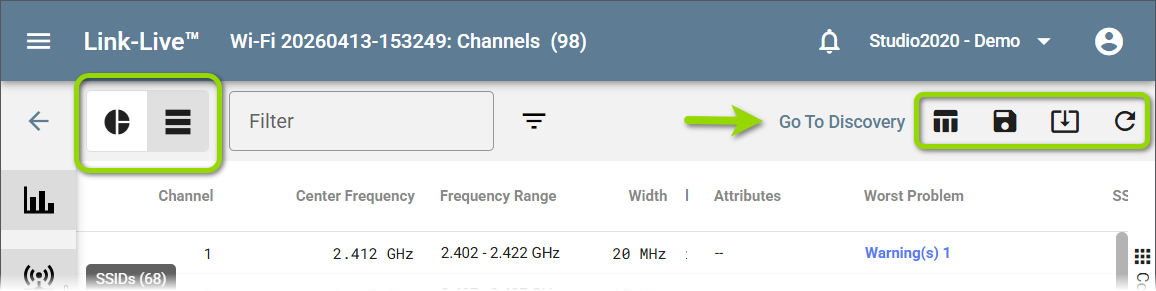
A Go To Discovery link in the upper right opens the associated Discovery Analysis result for the same session.
Use the back arrow in the upper left to return to the Analysis list.
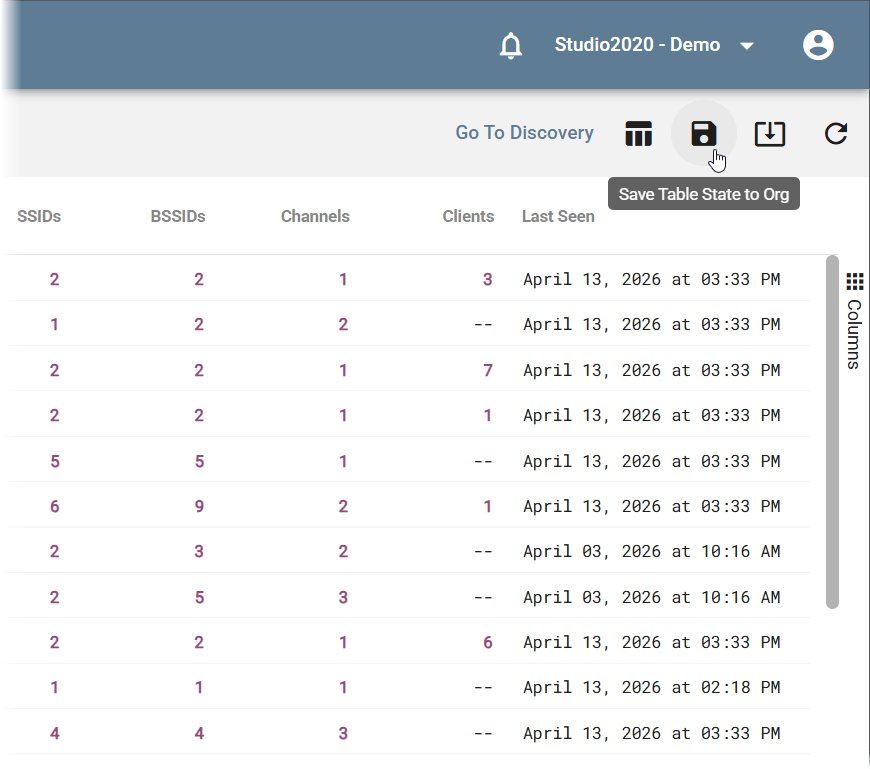
Sorting and Arranging Columns
Click a column header to sort the table by that column. Drag a column header to reorder columns. Changes can be saved using Save State to Org (see below).
Saving and Loading Table State
The toolbar includes options to save and restore the current table layout:
-
Save State – Saves the current column arrangement and sort order.
-
Load Org Table State – Loads the table layout saved for your organization.
Graph View
The Graph view displays wireless data in charts. Use the data type sidebar on the left to switch between the data types.
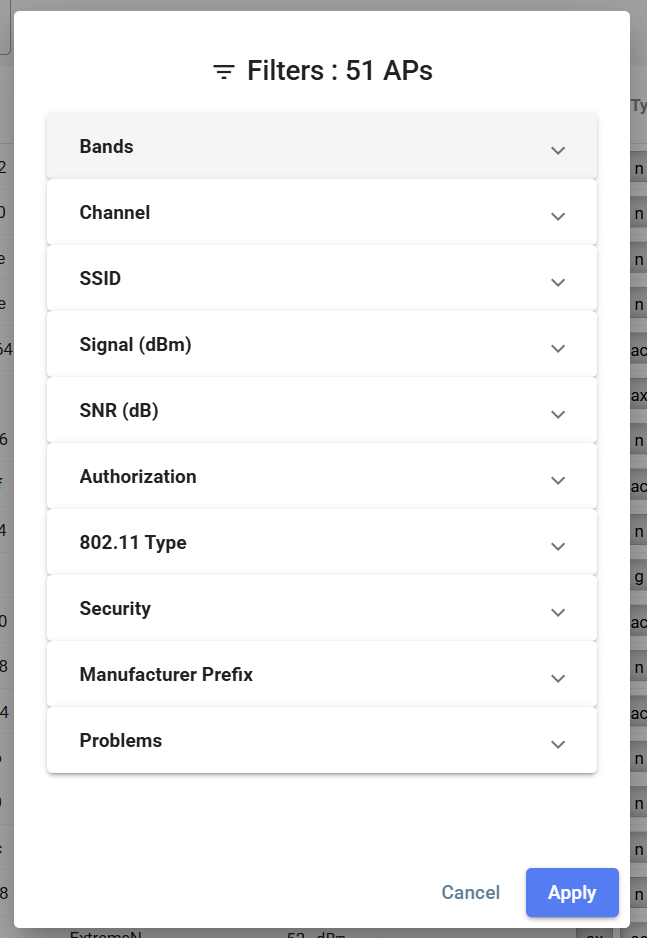
Filtering Wi-Fi Data
Two filtering mechanisms are available on the Wi-Fi Analysis screen:
-
Free string search – A text field above the table accepts partial strings or regular expressions. For example, entering "netgear" shows only data containing that string.
-
Structured filter panel – Click the filter icon in the toolbar to open the filter panel. Expand a category to select filter values, then click Apply. Click Cancel to discard changes.
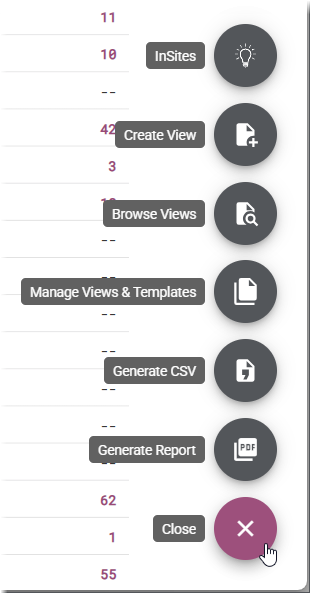
InSites
InSites is available in Wi-Fi Analysis to apply pass/fail thresholds to the wireless data and identify offending devices. Click the floating action button and select InSites to open the InSites panel. See InSites for full documentation.
Views, Templates, and Reports
The floating action button (bottom right) provides the following options for saving configurations and generating output:
-
Create View – Save the current display configuration as a named View.
-
Browse Views – Open and apply a previously saved View.
-
Manage Views & Templates – Review, apply, and delete saved Views and Templates.
-
Generate CSV – Export the current data as a CSV file.
-
Generate Report – Generate a PDF report. See Reports for details.
See Views and Templates for details on creating and managing Views and Templates.