Discovery Details Screens
Each Details screen shows additional information about the selected device, any Problems detected by the LR 10G, and counts for other connected or corresponding network elements.
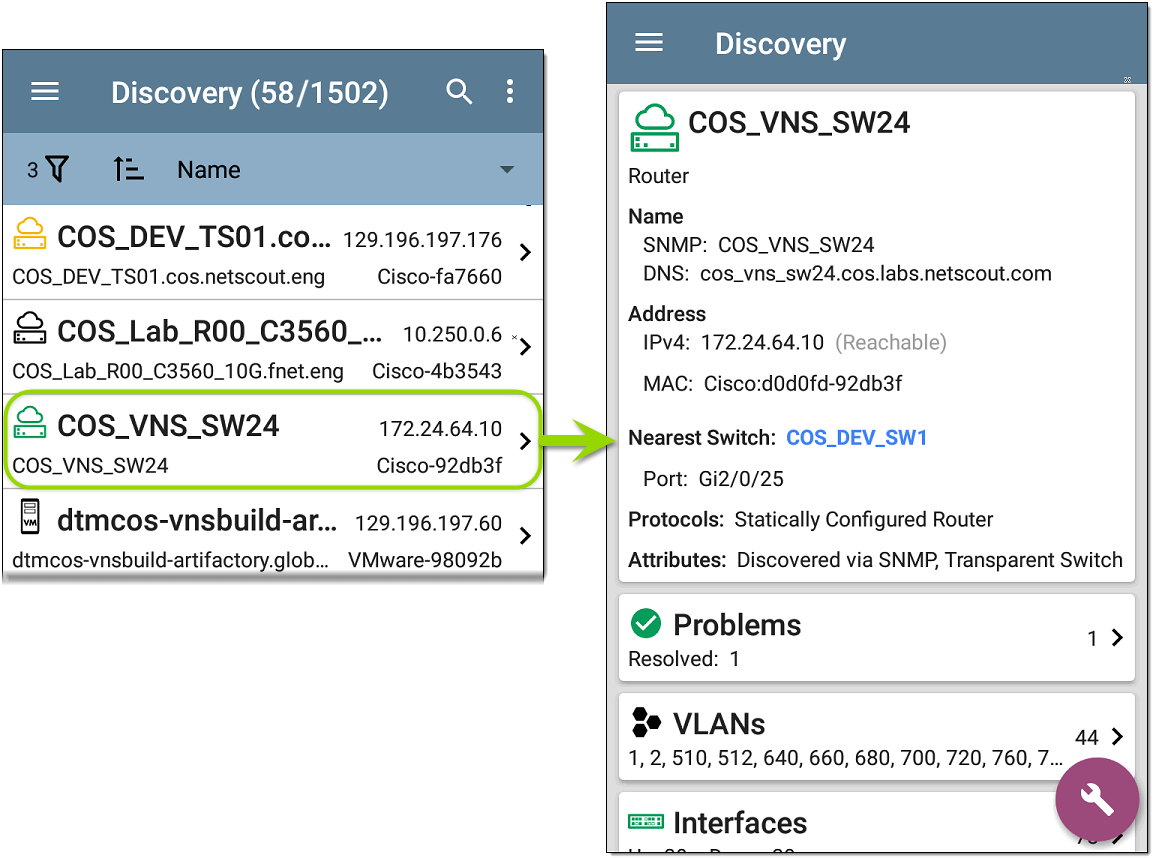
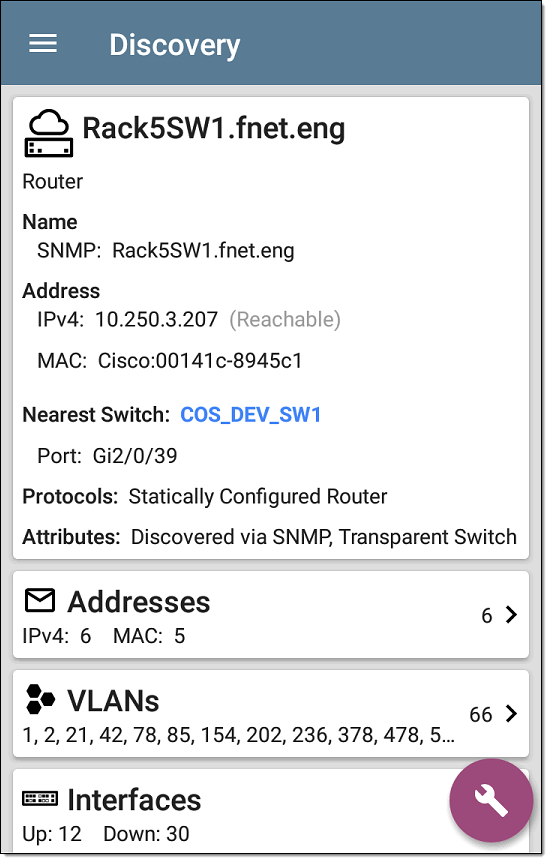
Tap any of the device cards on the main Discovery list screen to view Device Details.
The example below calls out a Router card and its Details screen.
In this Topic
Discovery App Floating Action Menu
The available data and actions on the Details screens vary significantly depending on the device type, connections, and data the LR 10G was able to discover. In other words, only the discoverable information for each device is shown on the Details screen.
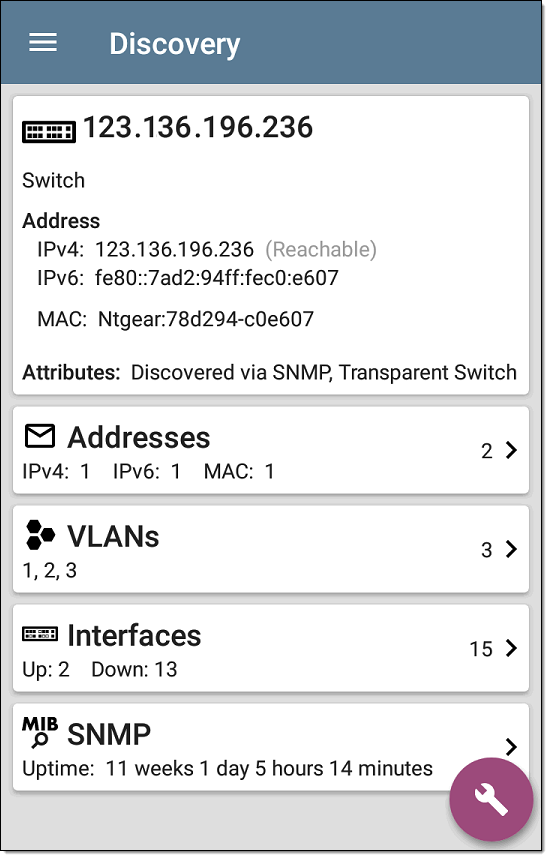
For the Switch screen shown above, Discovery was able to find an IP address but not a name for the switch.
Each Details screen also has a FAB button that lets you take additional actions or run other applications on the device. The available actions and applications depend on the device type and connection available. See Discovery App Floating Action Menu for more information.
See Device Types for specifics about the different devices the LR 10G can discover.
Top Details Card
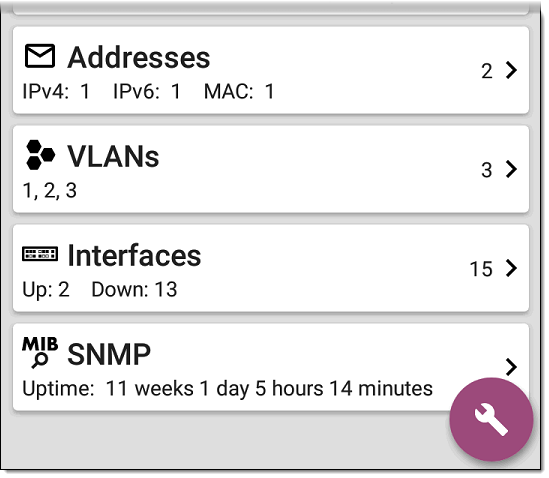
The top card on the Details screen summarizes the discovered data for the selected device.
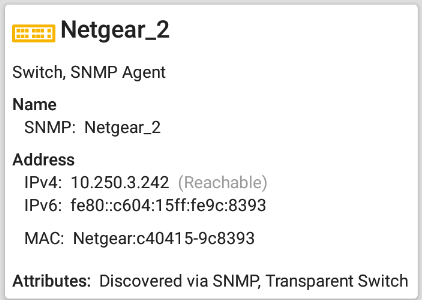
The top of the card shows the device type(s) and icon
The rest of the fields that appear on the top Details screen card depend on the device type and what the LR 10G can discover about the device.
On the Discovery Details screens, you can tap any blue linked name or address to open a Discovery screen for the linked device.
Data Fields on the Top Details Card
These fields may appear on the top card of a Device Details screen, depending on the device type and the information LR 10G discovered:
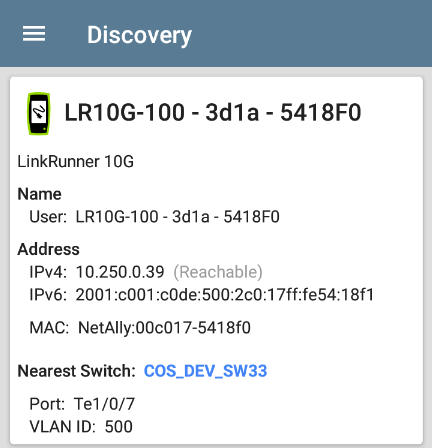
Name: Discovered hostname(s) of the device. This section can display user-defined, DNS, mDNS, SNMP, NetBIOS, AP, and Virtual Machine names as discovered.
Address: Discovered IPv4, IPv6, and/or MAC addresses of the device. This section displays the default (first discovered) addresses of each type. For more addresses, select the Addresses card when available.
Nearest Switch: Name or address of the switch identified as closest to the device
Protocols: Routing protocols, discovered via packet analysis, operating on the device or network
Services: Network services provided by this device, such as DHCP or DNS
Attributes: Other discovered attributes about the device
Hypervisor: Name of the hypervisor on which a virtual machine is operating
Virtual Machine: Name of the virtual machine
Last Seen: Time at which LR 10G most recently detected the device
Lower Cards in Device Details
Tap any of the lower cards on a Device Details screen to view more discovered characteristics and "drill down" to specific Problems, Addresses, Interfaces, etc. for the selected device.
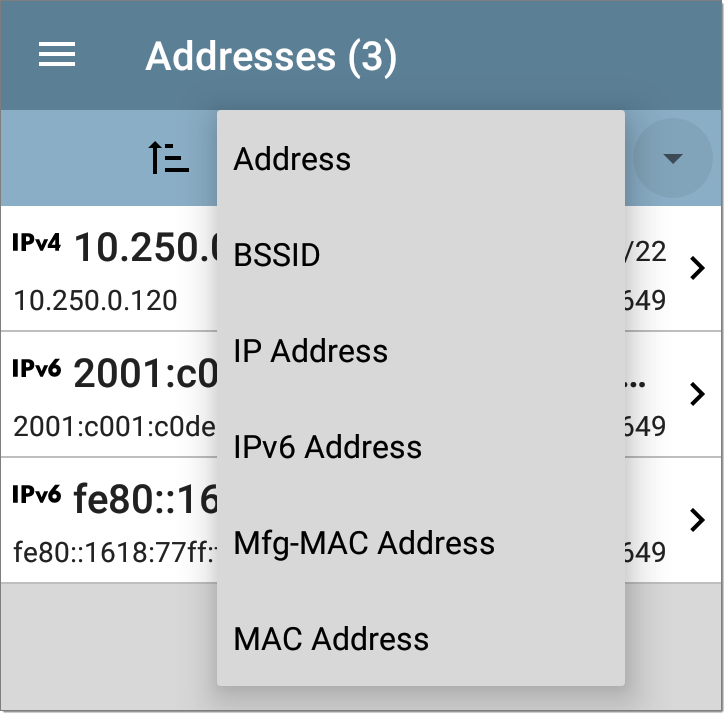
Screens with a list, such as Addresses shown below, also offer Sort options.
The rest of this topic provides examples of each type of Details screen and options for additional analysis.
Remember, you can tap any card with a right pointing arrow  to open a new screen with more information about the device or characteristic.
Problems
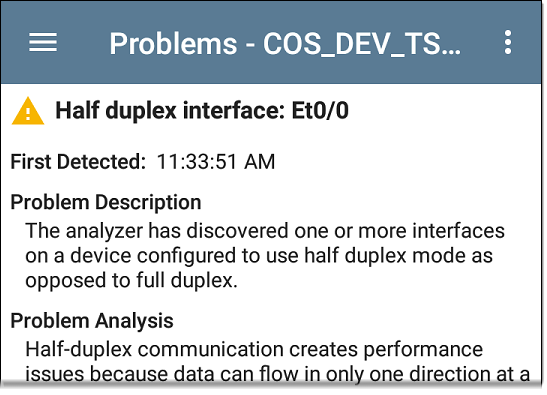
The Problems card shows the icon color of the highest severity problem, and the number of detected Warning, Failure or Error, Information, and Resolved conditions for the device or network component.
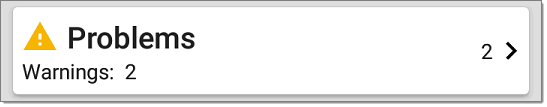
Tap the Problems card to view the Problems list screen (unless only 1 Problem is detected, in which case, the detailed Problem description opens, skipping the list screen).
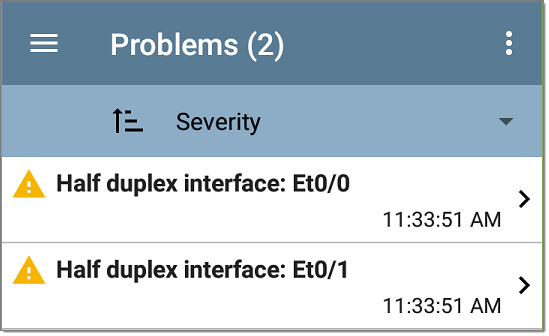
Tap the sort field to sort the list by Severity or by the time when the problem was First Detected.
On the Problems list screen, tap a Problem's row to read a detailed description.
To clear a problem, tap the action overflow button  at the top right of the Problem list or description screen, and then tap Clear Problem.
See Problem Settings to select which problems are detected and displayed by your unit.
Addresses
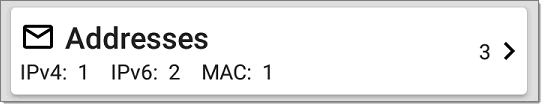
The Addresses card displays the number of each type of address discovered: IPv4, IPv6, MAC. Tap to view the addresses and related information.
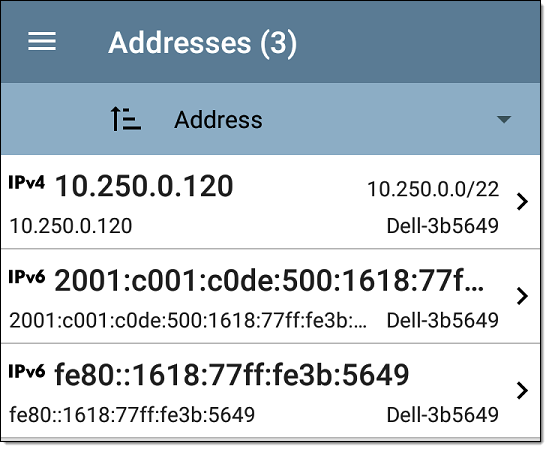
From the Addresses list screen, you can sort the list order and tap any of the discovered addresses to investigate the address further.
TCP Port Scan
If you have run a TCP Port Scan (from the Discovery FAB) on a device or IP address, a TCP Port Scan card appears on the device's Details screen.
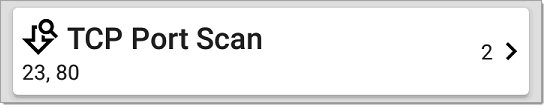
This card lists open port numbers and shows the total quantity of open ports. Tap the card to open the TCP Port Scan screen.
You can also open this screen from the Discovery floating action menu.
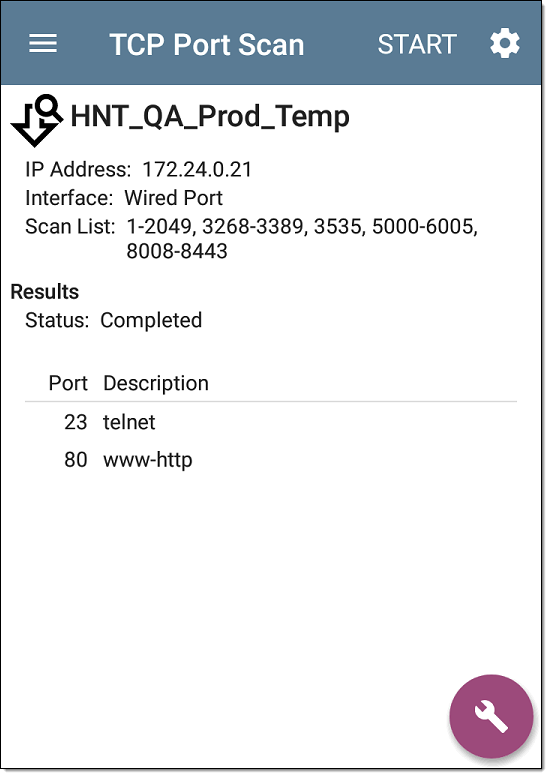
The top of the TCP Port Scan results screen shows the name or IP address of the tested device and the following fields:
IP address: IP address of the device that was scanned
Interface: Test or management port from which the test ran, set in the TCP Port Scan settings
Scan List: List of port numbers tested
Results
See also TCP Port Scan Settings.
VLANs
The VLANs card displays the VLAN IDs this device is using or for which it is configured.
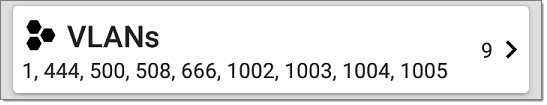
This card does not appear if no VLANs are detected or configured. Tap the card to open the VLANs screen.
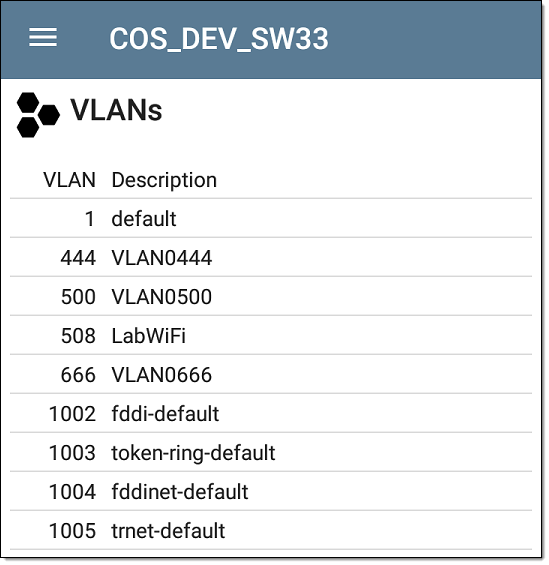
The VLANs Details screen also shows the description with each VLAN ID.
Interfaces
Interfaces are discovered using SNMP.
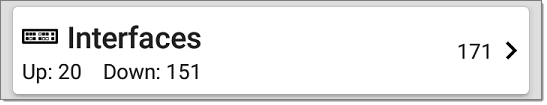
The Interfaces card shows the number of Up and Down interfaces and the total number of Interfaces to the right.
Tap the card to view the list of Interfaces.
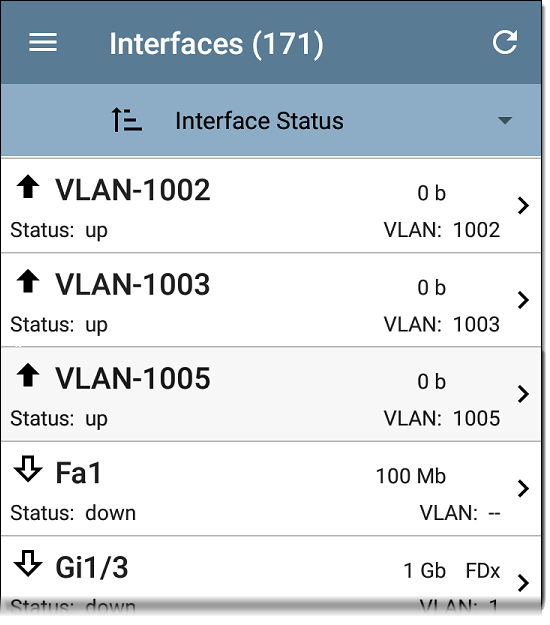
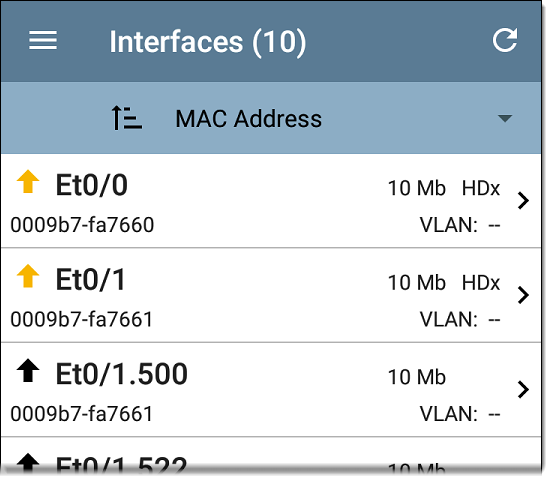
Like other Discovery list screens, the Interfaces list provides a number of Sort options, and the selected sort option affects the type of information displayed. The image above shows Interfaces sorted by Status (up or down). The image below shows Interfaces sorted by MAC Address, so each Interface's MAC address is displayed.
Tap an Interface row to open a new Discovery Details screen for that Interface.
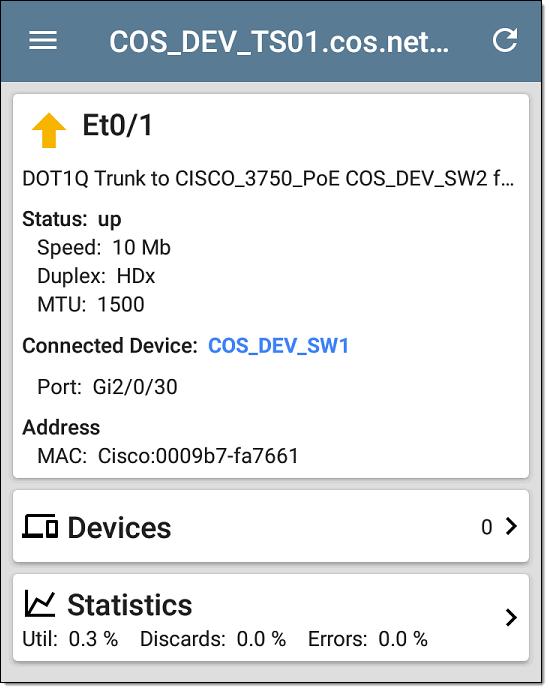
The Interface Details screen contains a description of the interface and information about its Status, Connected Device and Port, and Address.
MTU: Maximum Transmission Unit, the maximum packet frame size configured on the interface port
From this screen, you can tap the lower cards to review any discovery VLANs and Devices for the Interface as well as graphs of the Interface Statistics.
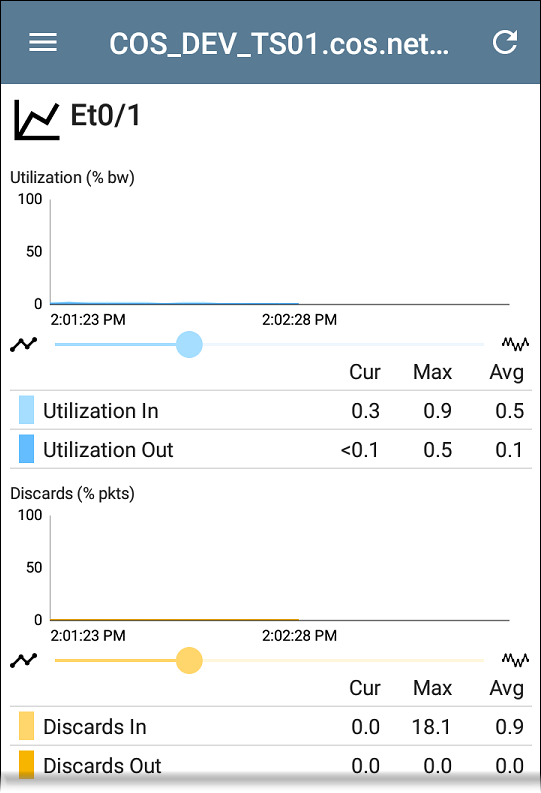
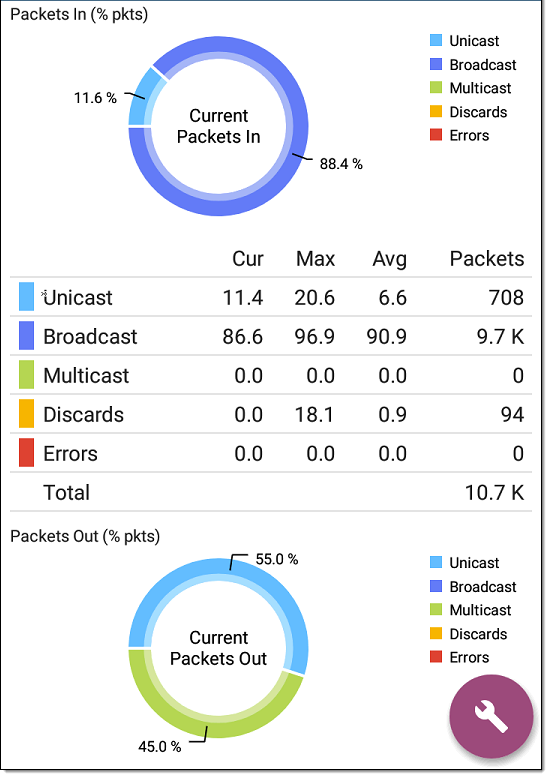
The Statistics screen displays real-time trending graphs of Utilization, Packet Discards, Packet Errors. See the Trending Graphs topic for an overview of the graphs' pan and zoom controls.
Below the trending graphs are pie charts of Packet transfers to and from the Interface.
SNMP
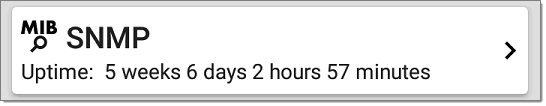
This card shows SNMP Uptime. Tap the card for additional details.
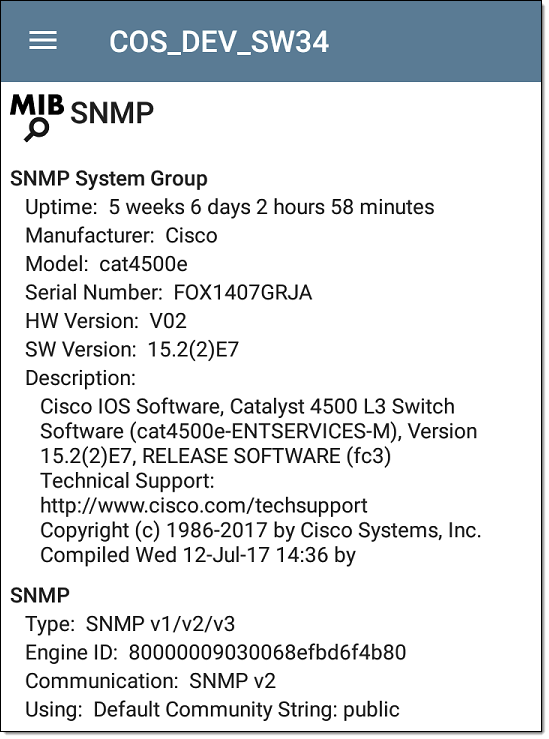
SNMP System Group: These data fields are gathered from the system group and other key device version information.
SNMP: SNMP versions the device supports, Engine ID (for v3), and how the LR 10G is currently communicating with the device, along with credentials, including the Community String in use.
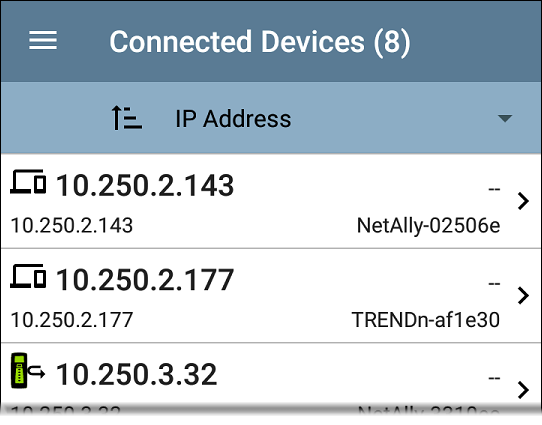
Connected Devices
The Connected Devices card appears on the Details screen for Unknown Switches. While the LR 10G may be unable to directly identify the connected switch, the devices connected to it provide clues about where the switch is operating.
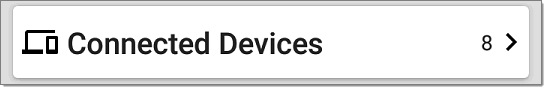
The Connected Devices card shows the number of discovered devices that are connected to the Unknown Switch. Tapping the card opens a Discovery list screen with the connected devices.
Resources
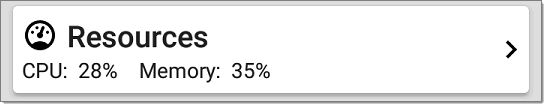
The Resources card shows the percentages of CPU, memory, and storage usage on the device. This information is gathered via SNMP.
Tap the card to view current and maximum resource utilization measurements.
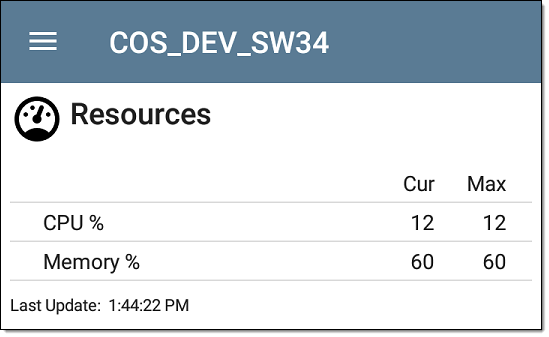
By default, LR 10G displays a Warning condition if CPU, Memory, or Storage utilization is above 90%. You can adjust problem detection and thresholds in the Problem Settings accessed from the Discovery navigation drawer.
 Discovery App Floating Action Menu
The floating action button (FAB) on Details screens offers additional actions depending on the device type and connection available.
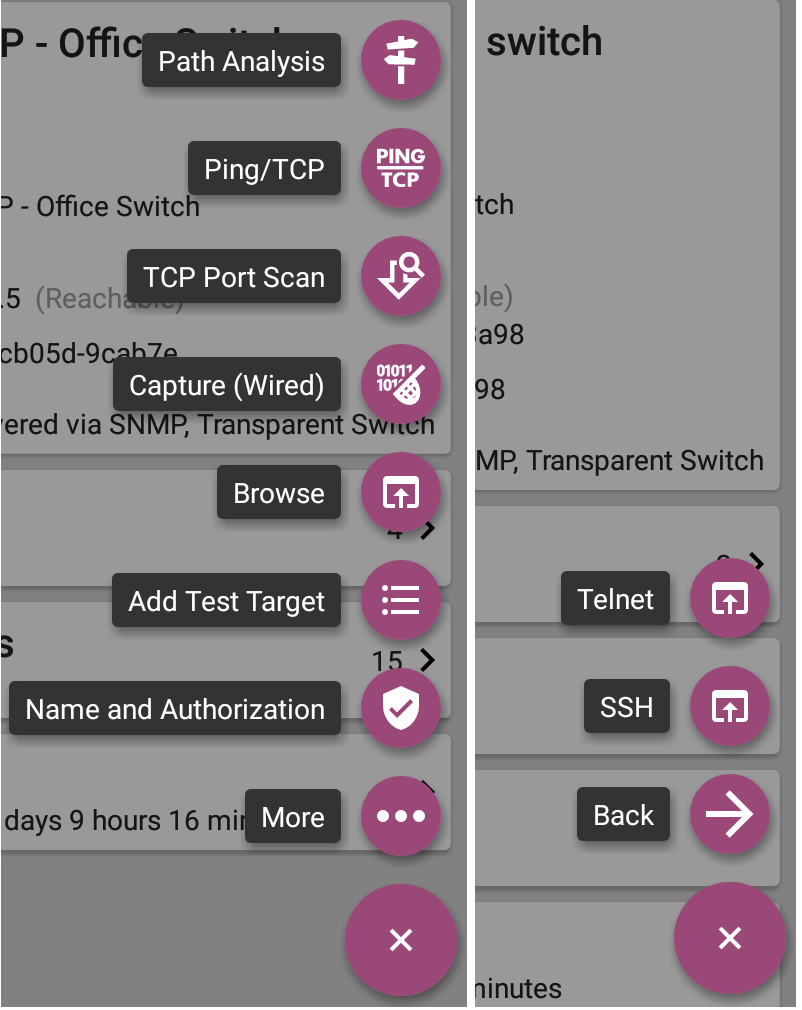
Opening other NetAlly apps, such as
-
Tap TCP Port Scan to open the TCP Port Scan screen in the Discovery app.
-
Tap Browse to open the Chromium browser.
-
Tap Add Test Target to create a new AutoTest target matching the currently selected device. A dialog first displays to select the test type, then the AutoTest app opens, displaying the newly added target’s settings. You can then further customize the target.
-
For devices with a MAC address, tap Name and Authorization to open a dialog that lets you assign a custom user name and Authorization status.
-
Tap More to open a secondary list of floating action buttons:
-
Tap Telnet or SSH to open the JuiceSSH app.
-
Tap Back to return to the primary FAB list.
-
Auto-Populating Device Addresses
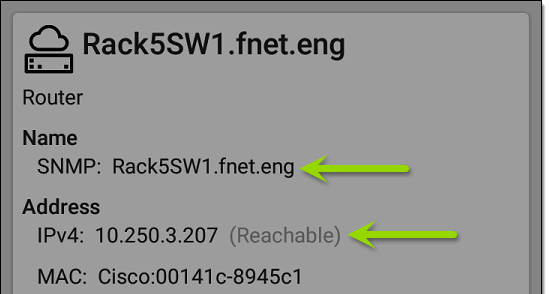
When another app is opened from the FAB, the default address and name shown on the Top Details Card are the targets populated.
For example, the Router shown in the Details screen below has multiple IPv4 and MAC addresses (which can be viewed by tapping the Addresses card).
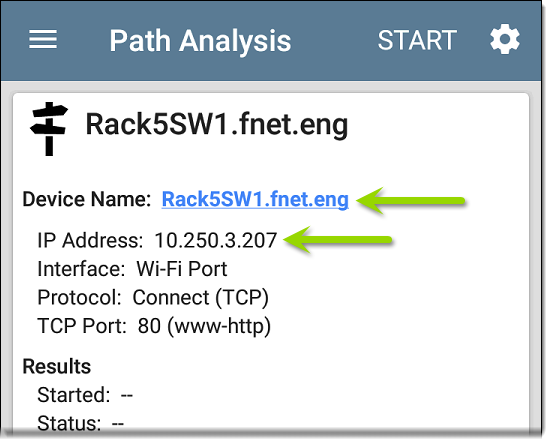
When you open the FAB and select a different app, such as Path Analysis, only the address and name listed at the top of the Details screen are populated in the Path Analysis app.
To open another screen or app with a different address, open the Addresses card, and select another address to view its Details screen.