Performance Test App Settings
The Performance app has both Performance settings that apply when the LR 10G is acting as the test source, and Peer settings that control the unit when it is acting as the test Peer.
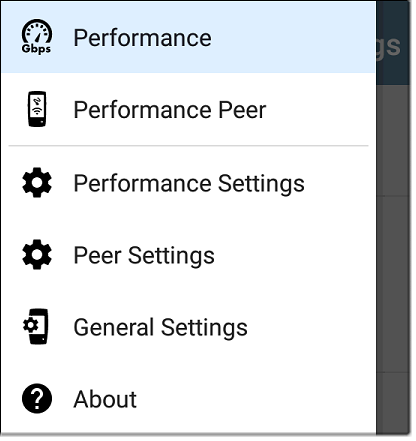
Access the settings by tapping the settings button ![]() on the Performance Test screen or the Performance Peer screen, or open the left-side navigation drawer
on the Performance Test screen or the Performance Peer screen, or open the left-side navigation drawer ![]() in the Performance app.
in the Performance app.
Performance goes to the main Performance test results screen.
Performance Peer opens the Peer results screen.
Performance Settings control the performance test settings when the LR 10G is the source.
Peer Settings control the LR 10G Performance Peer when another device is the source. See Running LinkRunner 10G as a Performance Peer.
Saving Custom Performance Tests
The Performance app allows you to save two levels of test configurations: individual Services and complete Performance Tests with up to eight enabled Services.
-
Services include the Endpoint, Frame Size, Bandwidth, grading Thresholds, and Layer 2 and 3 Options. Services can be used in any number of saved Performance Tests.
-
Saved Performance Tests contain a test Duration setting and the included Services.
For example, you can configure Services for multiple endpoints at different locations and with different bandwidths. A user can also create multiple Services with different QoS priorities (using the Layer 3 options) to verify that loss does not occur over the higher priority stream.
Saved Performance Tests and their Services work much like AutoTest Profile Groups, Profiles, and Test Targets. See the AutoTest Overview to review.
Open the Performance Settings screen ![]() from the main Performance results screen or the left-side navigation drawer
from the main Performance results screen or the left-side navigation drawer ![]() .
.
Tap the save icon  at the top right to load, save, import, or export a settings configuration.
-
Load: Open a previously saved settings configuration.
-
Save As: Save the current settings with an existing name or a new custom name.
-
Import: Import a previously exported settings file.
-
Export: Create an export file of the current settings, and save it to internal or connected external storage.
See Saving App Settings Configurations for more instructions.
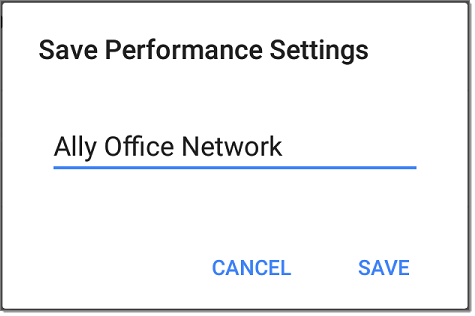
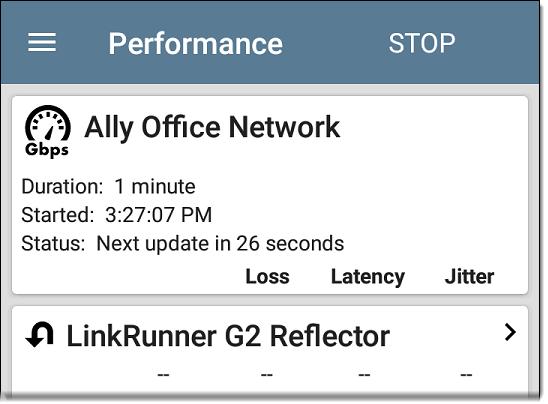
In the example images here, the user has saved a custom Performance Test called "Ally Office Network."
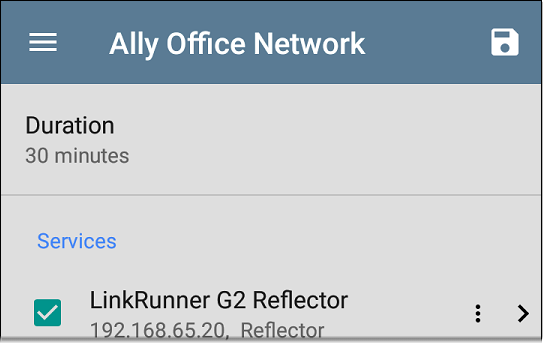
Once you save a Performance Test configuration, the custom name you entered appears at the top of the Performance Settings screen (above) and main Performance Test screen (below).
Configuring the Source LinkRunner 10G
Open the Performance Settings screen from the main Performance results screen ![]() or the left-side navigation drawer
or the left-side navigation drawer ![]() .
.
Changed settings are automatically applied. When you finish configuring, tap the back button  to return to the Performance test screen.
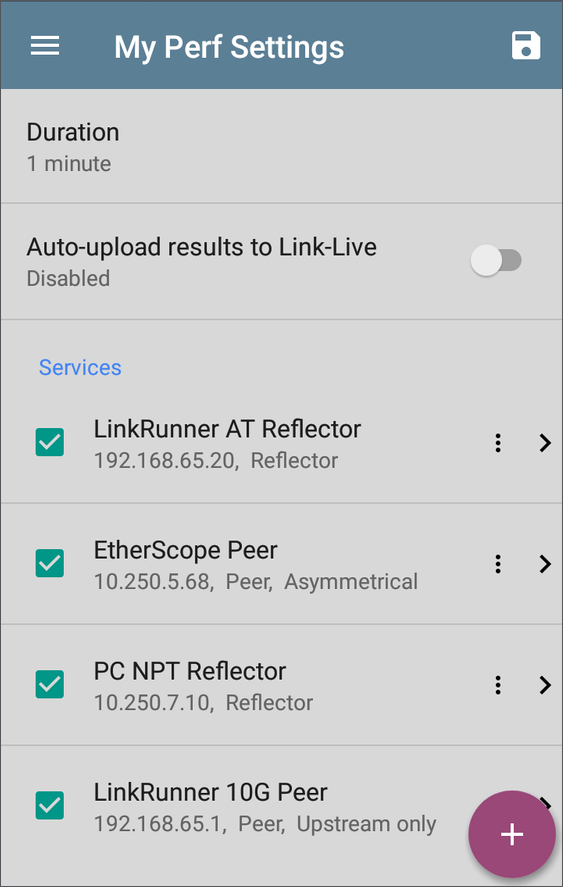
Duration: This setting is the length of time the Performance test runs. Tap the field to select a new duration. The default is 1 minute.
Auto-upload results to Link-Live: When enabled, the Performance app automatically uploads test results to Link-Live each time a test completes.
Services
A Service is a configured traffic flow that simulates application traffic. You can run up to four unidirectional or bidirectional services simultaneously to emulate and test the QoS levels on your network.
The Services configurations include the Endpoints, Frame Size, Bandwidth, Thresholds, and Options the LR 10G uses to measure and grade performance.
Your collection of configured Services is available across all of your saved Performance Test configurations, and if you delete a Service, it is deleted from all Performance Tests.
On the Performance Settings screen, you can perform the following actions:
-
Check or uncheck the boxes to include or exclude Services in the list of active Performance tests.
NOTE: You can run a Performance Test on up to eight Services at once. If you select more than eight Services, the Performance Test fails.
-
Tap the action overflow icon
 to Duplicate, Move Up/Down, or Delete a configured Service.
CAUTION! When you delete a Service, you delete it from all Performance Test configurations. To remove a Service from the current test, simply uncheck it.
NOTE: All Services are tested at the same time, so the order of Services listed on this screen does not affect how the test runs.
-
Tap the FAB icon
 to add a new Service.
 -
Tap any Service's name, or add a new Service, to open its settings, where you can enter a custom Service name, endpoint address, performance thresholds, and other Service characteristics.
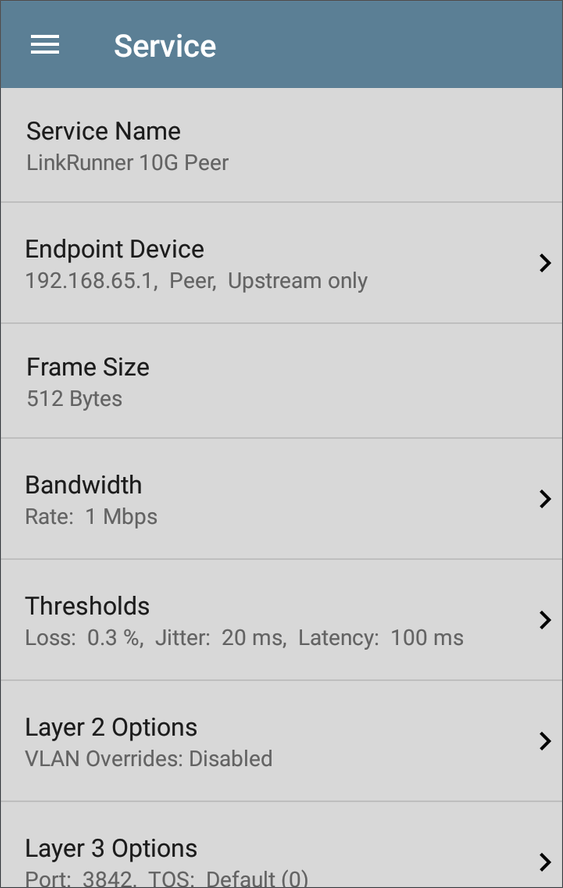
Service Name
Tap the Service Name field to enter a custom name for the endpoint and associated settings. This name appears on the Services screen and the Performance test screen.
Endpoint Device
Open this screen to configure the Endpoint Address, Type, and Traffic Flow.
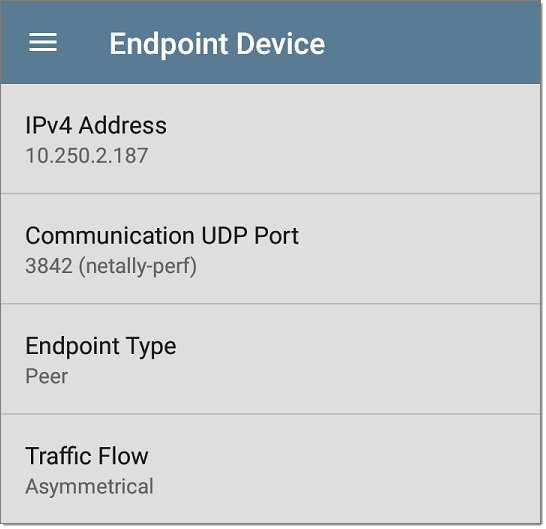
IPv4 Address: Tap the field to enter the IPv4 address of your endpoint device.
Communication UDP Port: If needed, tap to enter a different UDP Port number. The default NetAlly performance test port is 3842.
NOTE: The UDP port number entered here must match the port number used by your Peer endpoint device.
Endpoint Type: Select Peer or Reflector depending on the type of endpoint you are using for the performance test.
Traffic Flow: This setting only appears when Endpoint Type is set to Peer.
-
Select Upstream only or Downstream only to test only the single traffic flow direction specified.
-
Select Asymmetrical to test each direction using a different Target Rate (set under Bandwidth below). Asymmetrical is the default traffic flow for a Peer endpoint.
-
Select Symmetrical to test both directions using the same Target Rate.
Frame Size
Tap the Frame Size field to select a new single frame size, the Frame Size Mix option, or to enter a Custom Value. The default is 512 bytes.
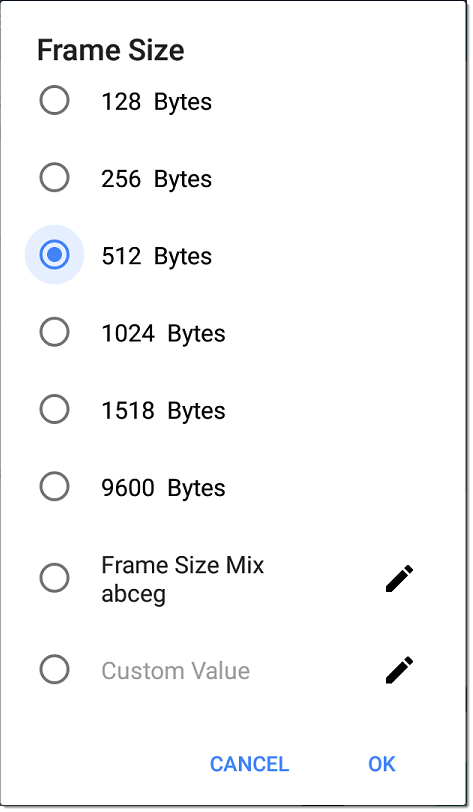
Selecting Frame Size Mix creates traffic with variable frame size patterns, generated in a repeating sequence. Tap the edit icon  to revise the frame size pattern.
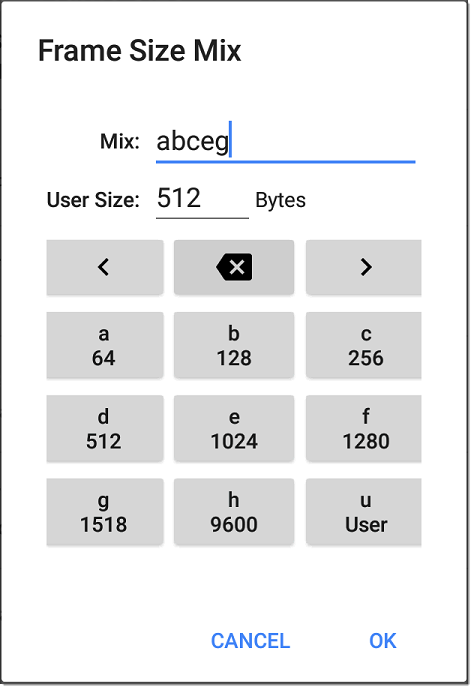
On the Frame Size Mix keyboard shown above, each letter (a through h) is associated with a frame size. The default pattern is "abceg," meaning the traffic pattern follow a repeating sequence of 64, 128, 256, 1024, and 1518 bytes. Use the letter keys along with the arrows and backspace button to edit the mix sequence as desired.
The u key enters a user-defined size into the mix. Select the field next to User Size: to enter your desired frame size, between 64 and 9600 bytes. Tap the u key to insert the new size where you want it in the pattern.
NOTE: If the Performance Test runs on a VLAN (configured in the Wired AutoTest Profile or the Performance Layer 2 options shown below), the frame sizes are four bytes longer. You do not need to account for this frame size increase in the settings.
Bandwidth
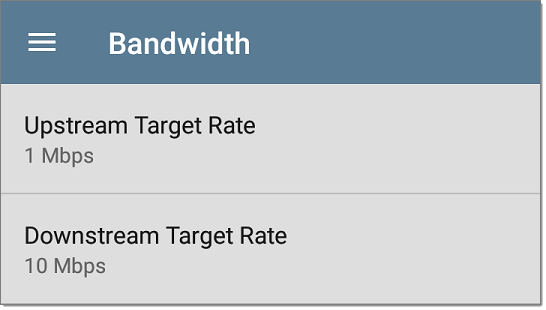
Tap to open the Bandwidth screen and select or enter a Target Rate for one or both traffic directions.
- If you are configuring a Reflector endpoint or you have selected Symmetrical Traffic Flow for a Peer endpoint, only one Target Rate is used.
- For a Peer with an Asymmetrical Traffic Flow configuration, you can select a different Upstream and Downstream Target Rate for each direction.
Tap the Target Rate field(s) to select or enter a new rate.
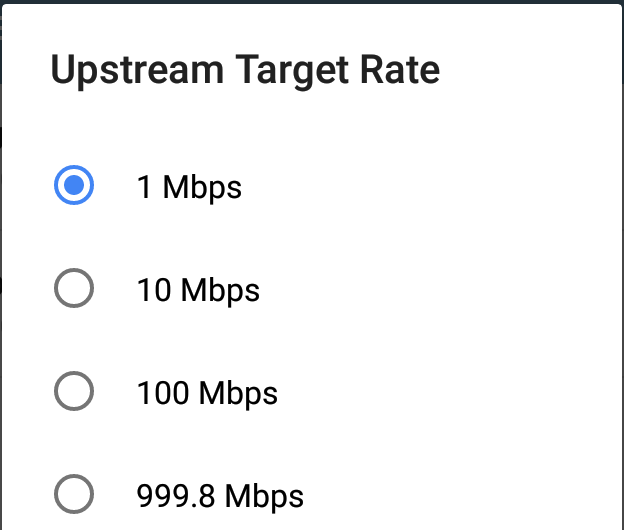
Target Rate: The requested rate of round-trip traffic
Upstream Target Rate: This is the requested rate of upstream traffic, from the source to the endpoint.
Downstream Target Rate: This is the requested rate of downstream traffic, from the endpoint to the source.
NOTE: The 99.98 Mbps and similar values provided in the Target Rate options are meant to test the maximum, worst case throughput on an Ethernet link. Though greater rates are possible under perfect conditions, the limitation of 99.98% of the link rate results from asynchronous clocks in Ethernet. The IEEE 802.3 Ethernet standard allows link partners to differ by up to 0.02% of their clock signals. Therefore, end-to-end throughput in the worst case may be limited to 99.98% of the source link rate when the traffic traverses a link and maximum clock differences occur between the two link partners.
Thresholds
Thresholds define the Pass/Fail criteria the LR 10G uses to grade the test. The Performance Test thresholds are Frame Loss, Jitter, and Latency.
-
If you are configuring a Reflector endpoint or you have selected Symmetrical Traffic Flow for a Peer endpoint, the same threshold values grade each traffic direction.
-
For a Peer with an Asymmetrical Traffic Flow configuration, you can select different Upstream and Downstream thresholds.
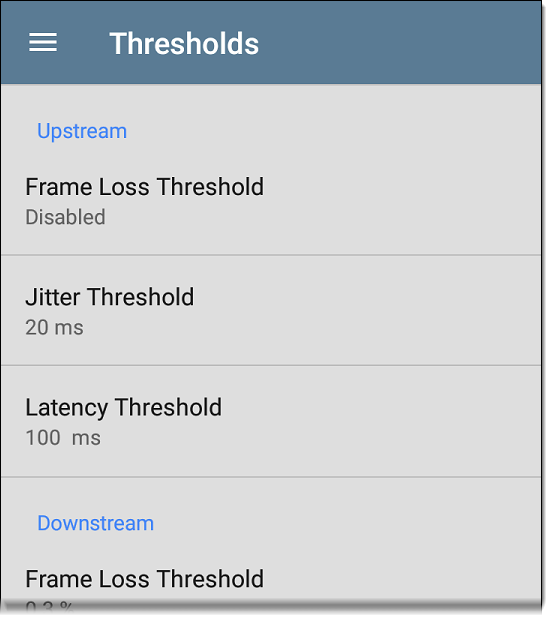
Tap each Threshold field to select or enter the maximum value allowed. If a measured value exceeds the threshold value, the test fails.
Frame Loss Threshold: The Frame Loss Threshold is the percentage of frames that can be lost before the test fails. The default is 0.3%. Tap the field to select or enter a new threshold or to disable grading based on frame loss altogether.
Jitter Threshold: Jitter is a measure of the variation in frame-to-frame latency in milliseconds. The default threshold is 20 ms.
Latency Threshold: Latency is the amount of time it takes for a packet to go from the source to the endpoint and endpoint to source in milliseconds. The default threshold is 100 ms.
Layer 2 Options
The Performance Test runs over the Wired Test Port link established by an AutoTest Wired Profile. Therefore, by default, the Performance Test runs using the VLAN ID configured in the settings of the Wired AutoTest Profile that established the link.
To test other VLANs, for example, those that make up a trunk port, configure the Layer 2 Options in your separate Services to test the corresponding VLANs.
Open Layer 2 Options in the Performance app settings to override the VLAN settings from AutoTest.
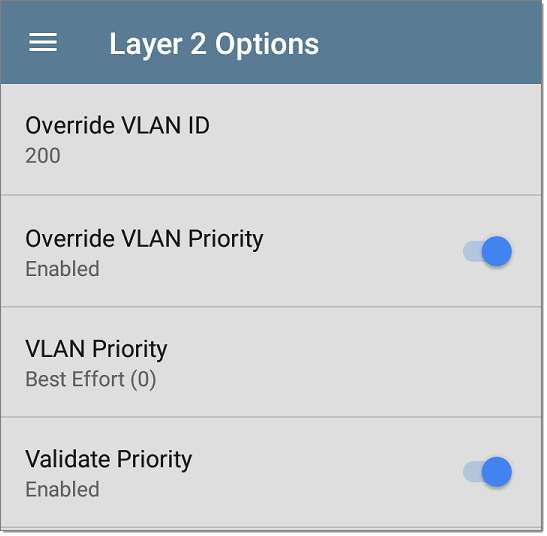
Override VLAN ID: Tap to select or enter a VLAN ID number. The Override VLAN ID function tags frames with a particular VLAN (for example, a VLAN used for voice, video, or data). If Override VLAN ID is not enabled, the VLAN is set to the value used for the Wired Test port.
Override VLAN Priority: Tap the toggle button to enable. By default, the VLAN priority is set to Best Effort (0). Use this setting to simulate a traffic stream of a certain type. If Override VLAN Priority is not enabled, the VLAN priority is set to the value used for the Wired Test port.
VLAN Priority: This setting only appears if the Override VLAN Priority setting above is Enabled. Tap to select a VLAN Priority.
Validate Priority: Tap the toggle button to enable the LR 10G to validate the selected VLAN priority. When the Validate Priority option is enabled, LR 10G checks the packets it receives to ensure that the priority field has been maintained from source to destination. If it has been altered, packets are counted as lost and included in the Frame Loss measurement.
Layer 3 Options
Layer 3 options are useful when testing QoS (Quality of Service) on your network. You can create up to four Services using different DSCP priority or IP precedence to verify that loss does not occur on the higher priority streams.
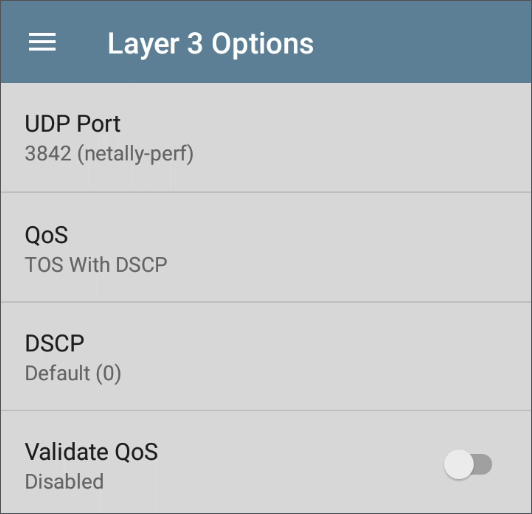
UDP Port: Tap to enter a specific UDP port number. This can help you simulate prioritized traffic on ports reserved for specific uses such as video, voice, or backup data or to match ports allowed by a firewall.
QoS: Select the methodology used on your network: TOS with DSCP (Type of Service with Differentiated Services Code Point or TOS with IP Precedence (legacy). Then, configure the priority using the settings below.
DSCP: This field is only available when TOS with DSCP is selected in the setting above. Using the DSCP control, you can specify a priority for the generated traffic by changing its classification. This is a six-bit field. The default value of zero specifies “Best Effort.” Tap the field to select a different DSCP.
IP Precedence: This field is only available when TOS with IP Precedence is selected. Tap the field to select an IP Precedence other than the default of Routine (0).
IP Precedence Type: This field is also only available when TOS with IP Precedence is selected. Tap the field to select an IP Precedence Type other than the default of Normal (0).
Validate QoS: When this setting enabled, the LR 10G checks received packets to ensure that the QoS field has been maintained throughout the route. If the QoS field has been altered, packets are counted as lost.