Survey Heatmap
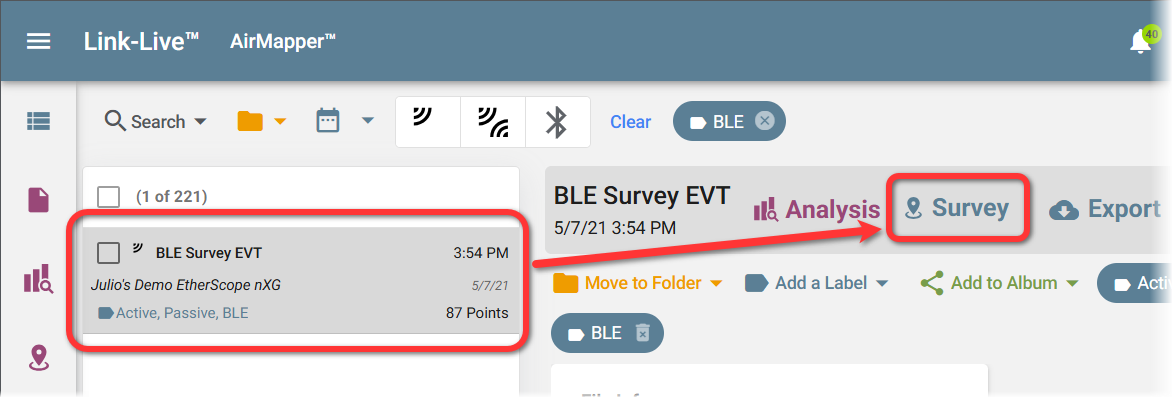
Click the Survey button above the detail panel to open the survey heatmap page.
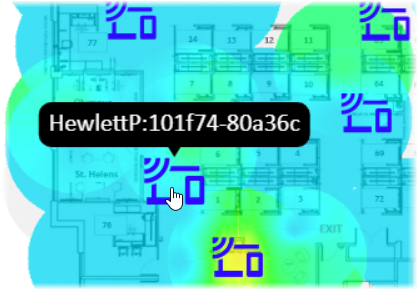
This screen displays a full-page view of heatmap data overlaid on the floor plan. Each colored circle represents a single scan taken during the surveying session.
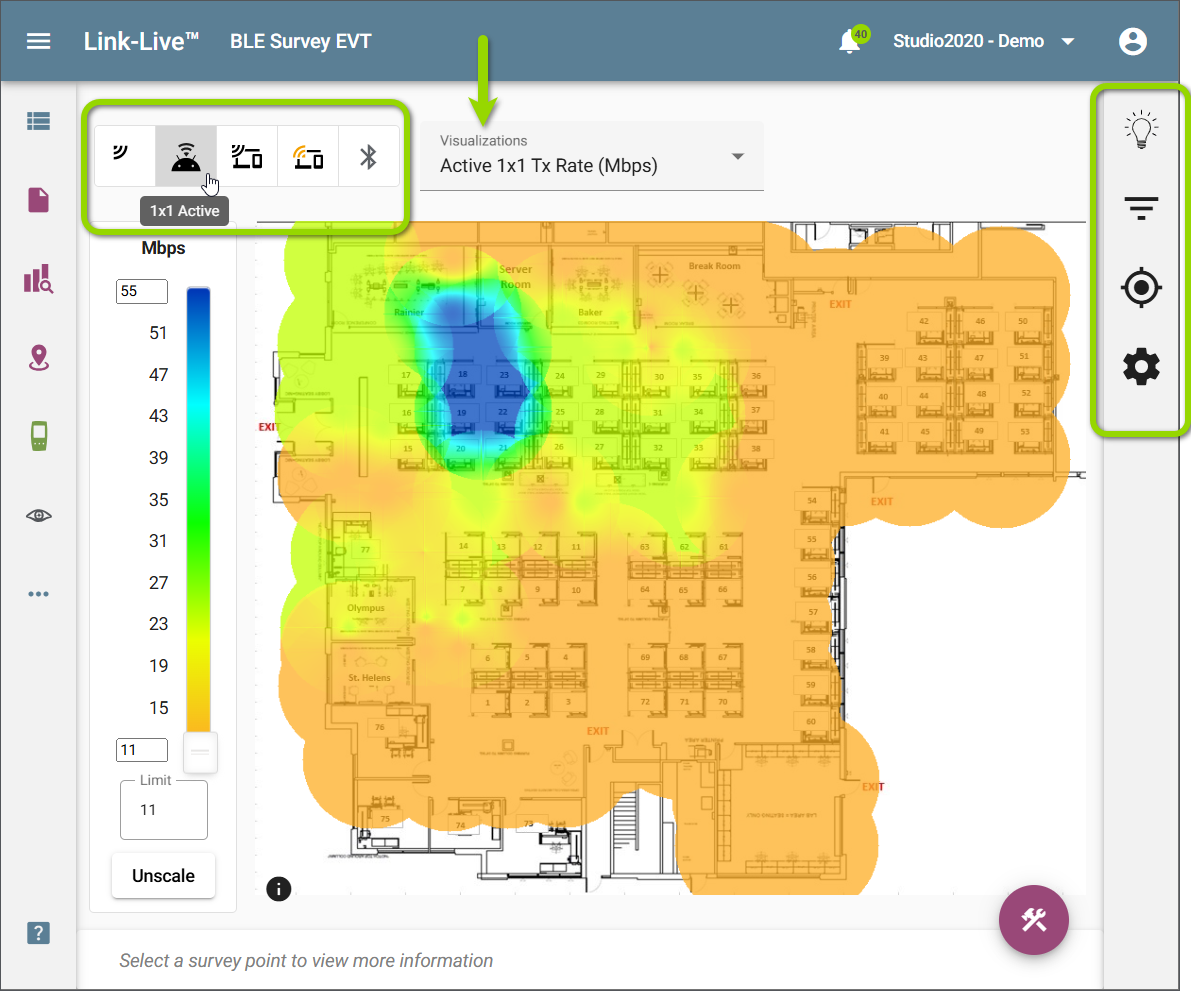
Use the mode buttons across the top left, Visualizations dropdown menu, and right-side menu tools to view different types of data and examine coverage and performance across the survey area.
Survey Modes
Depending on the type of Survey taken by the tester, different data modes can be displayed on the heatmap. NetAlly Wi-Fi testers can gather network data both Actively (connected) and Passively. Passive surveys can include data for multiple modes—1x1 Active measurements, Clients, Probing Clients, and Bluetooth—depending on what was enabled at survey time. See the User Guide for your tester for more information on AirMapper Survey Modes.
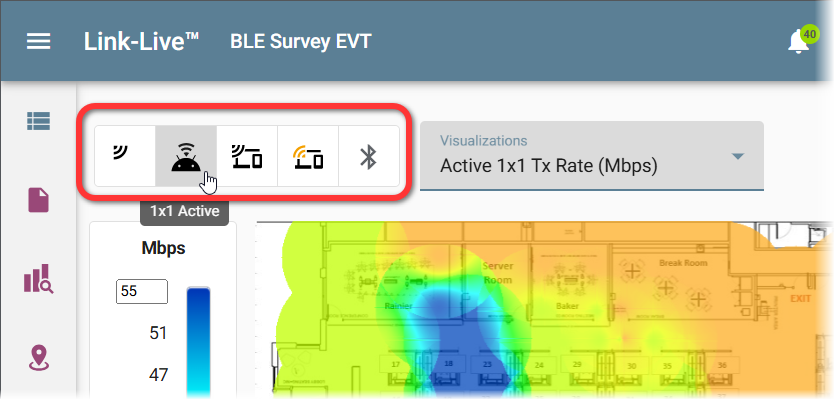
The Survey mode buttons across the top of the map include the following options:
-
Passive – RF measurements from access points detected by the tester's passive Wi-Fi scan as it moved through the space.
-
Active – Gathers survey information from the active connection on the Wi-Fi Test Port rather than from passive scanning. Reflects network experience from the perspective of a connected client.
-
1x1 Active – Gathers survey information from the active connection on the Management Port, using the tester's 1x1 antenna configuration.
-
Clients – Locations and signal levels of connected Wi-Fi client devices detected during the survey, such as IoT devices, laptops, and smartphones.
-
Probing Clients – Wi-Fi devices actively sending probe requests but not yet connected to a network.
-
Bluetooth – RSSI of Bluetooth and BLE devices detected across the floor plan, collected in parallel with the Wi-Fi survey.
Visualizations
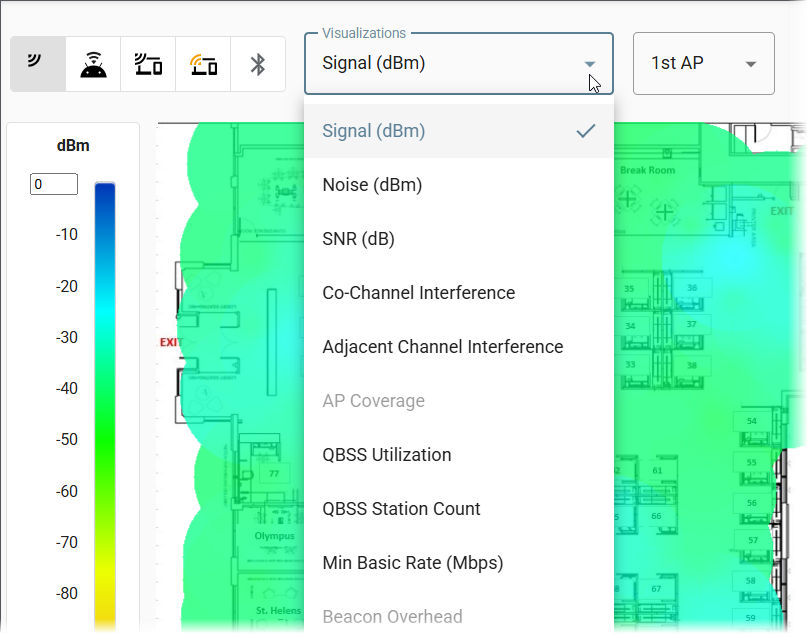
Use the Visualizations dropdown to select the heatmap metric: for example, Signal (dBm), Noise (dBm), SNR (dB), Co-Channel Interference, Adjacent Channel Interference, AP Coverage, QBSS Utilization, or QBSS Station Count. Some visualizations require an AllyCare subscription.
NOTE: Visualizations applied on the heatmap remain active when you switch between survey modes, making it easy to compare coverage and performance for the same network segments across different data types.
In Bluetooth mode, BLE data is collected in parallel to passive and active Wi-Fi surveys when Bluetooth is enabled on the tester at survey time.
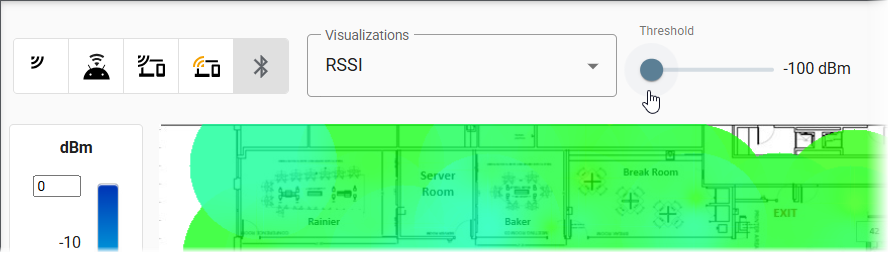
For some visualizations, a threshold slider appears. Only Bluetooth devices transmitting at or above the threshold are included in the heatmap.
Heatmap Display
The heatmap overlays signal data on the floor plan using a color-coded scale. The color legend on the left side of the map is editable. Enter custom range values to adjust the display.
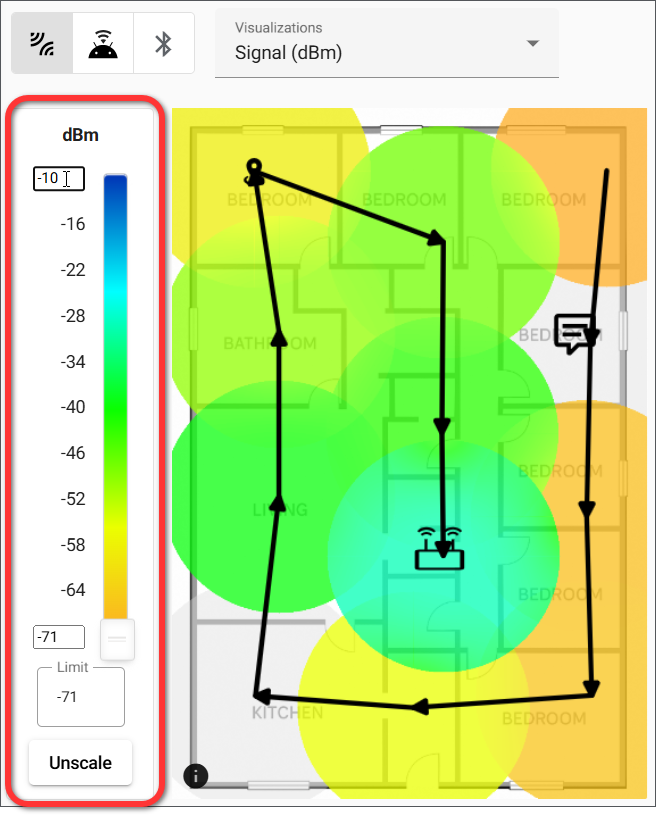
Click AutoScale to fit the legend to the current data range, or Unscale to reset to defaults. Values below the minimum set in the legend are grayed out on the map, making it easy to identify areas that fall below a desired threshold.
NOTE: The following heatmap types require an active AllyCare subscription: Noise, SNR, Adjacent Channel Interference, Co-Channel Interference, AP Coverage, Min Basic Rate, Beacon Overhead, Max TX Rate, Max RX Rate, Max TX MCS, Max RX MCS, QBSS Utilization, and QBSS Client Count.
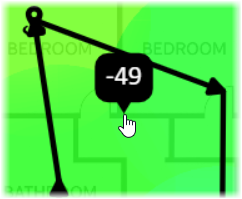
Navigate the map by clicking and dragging to pan and using the scroll wheel to zoom. Hover the mouse over a data point to display the relevant measurement based on the current map view.
Comment annotations can be added to the map to notate features or issues. Hold Ctrl (Windows) or Command (Mac) and click the map to add a comment at that location.
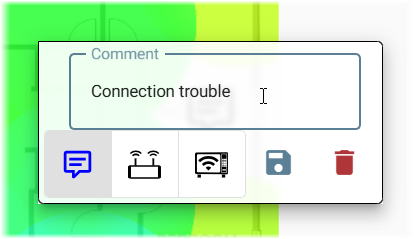
Each comment includes a text field and can be marked with an AP icon or an interferer icon. Use the save and delete icons in the comment pop-up to manage annotations.
Data Table
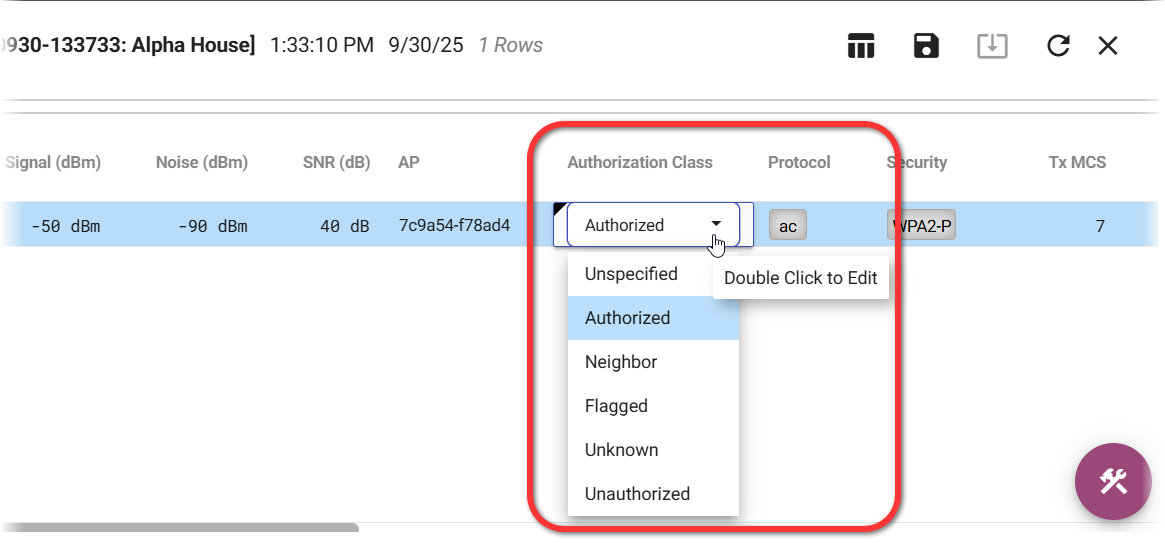
Clicking any survey point opens a table below the map that lists all available details for the selected scan.
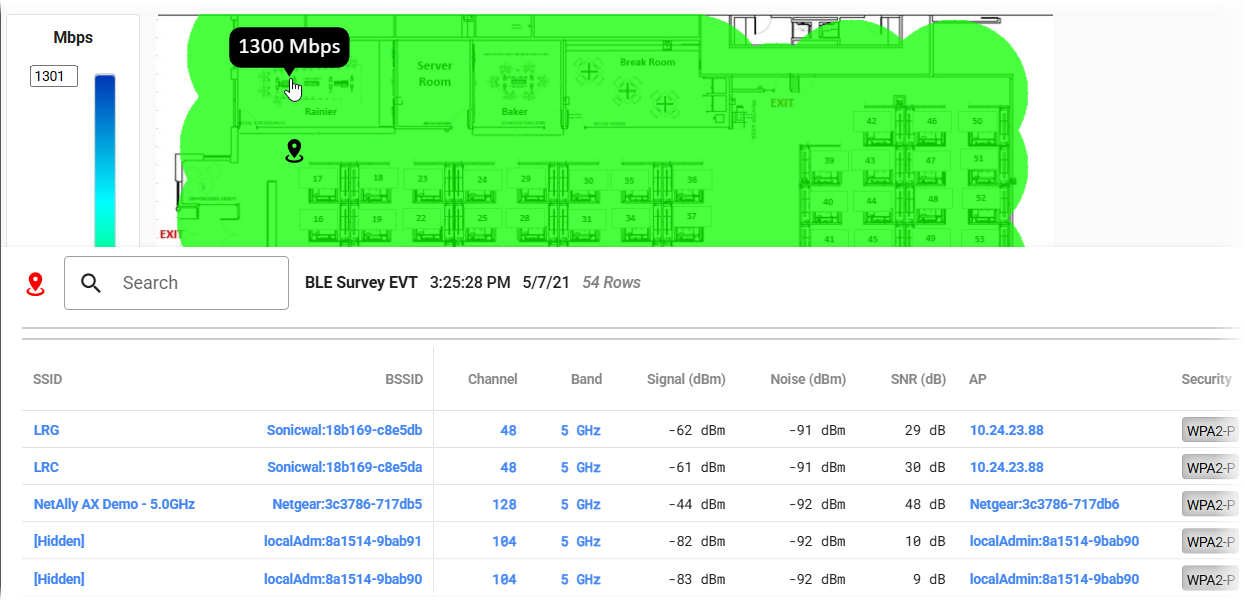
The table includes Wi-Fi analysis details such as SSID, BSSID, Band, Channel, AP, Signal (dBm), Noise (dBm), SNR (dB), Security, Tx Rate (Mbps), and Channel Width and other beacon information.
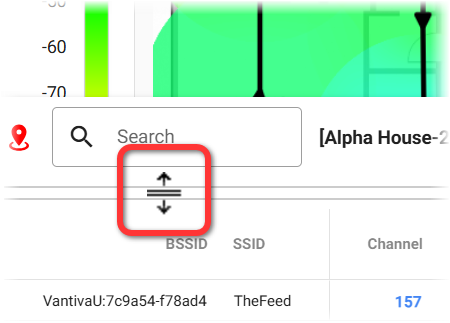
Columns are sortable by clicking the column header and repositionable by dragging.
Drag the resize handle between the map and table to adjust how much of each is visible.
To set the authorization class for a device in the table, double-click the Authorization Class cell and select a value: Unspecified, Authorized, Neighbor, Flagged, Unknown, or Unauthorized. Changes apply everywhere that device appears in the current survey.
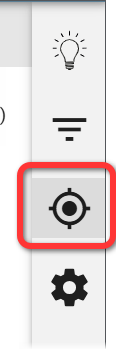
Right-Side Menu
A menu on the right side of the survey map provides access to Heatmap Filters, InSites, Locations, and Settings.
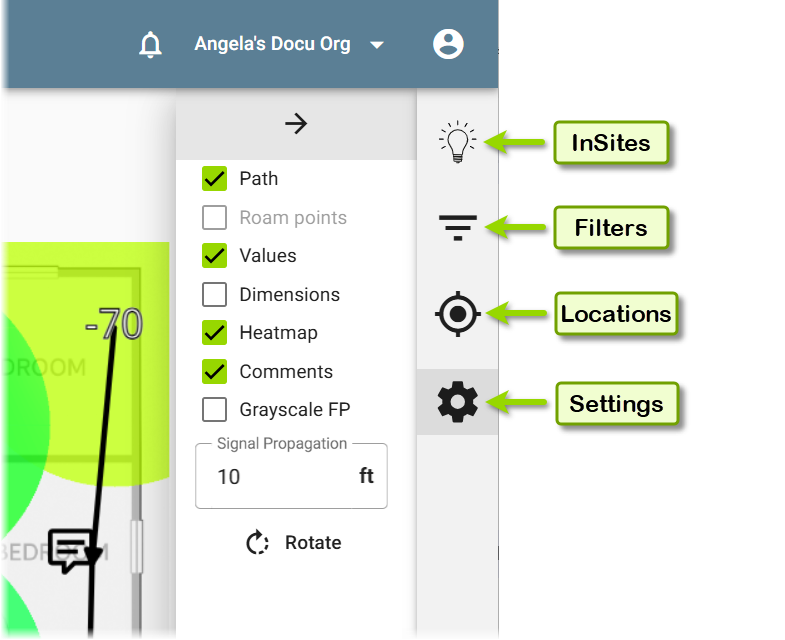
InSites
InSites analyzes survey data against configurable thresholds and displays Pass/Fail indicators across the floor plan. See InSites for full documentation.
Heatmap Filters
Click Filters in the right-side menu to filter the heatmap display by specific criteria.
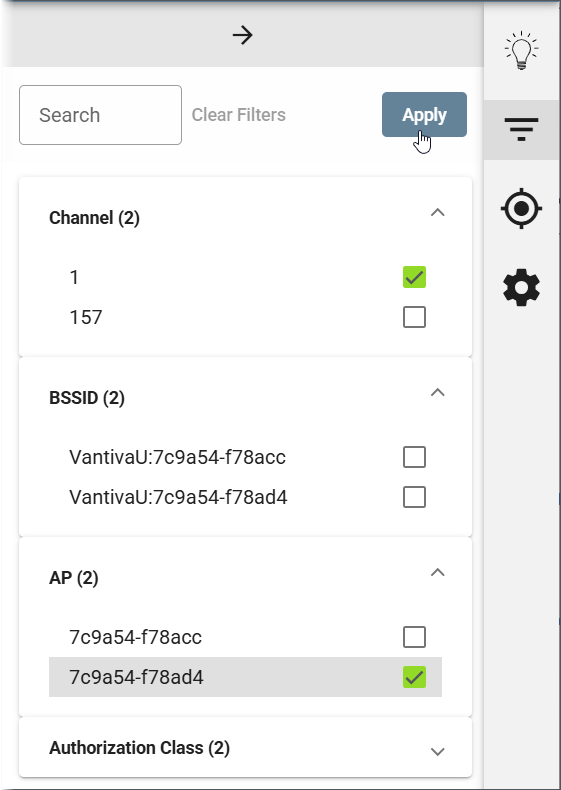
NOTE: Full heatmap filtering requires an active AllyCare subscription. AllyCare-enabled filters include SSID, Band, Channel, BSSID, AP, 802.11 Type, Channel Width, Security, and Authorization Class.
Multiple filter criteria can be combined to narrow the display. Applied filters appear in the filter bar above the map and can be removed individually with the X on each.
See Searching and Filtering for an overview of how filters work in Link-Live.
Device Locations
Click Locations in the right-side menu to open the Locations panel. Use the Enable Locations toggle to show or hide device location markers on the map. Each device category (APs, Clients, Probing Clients, and Bluetooth) can be shown or hidden individually using checkboxes.
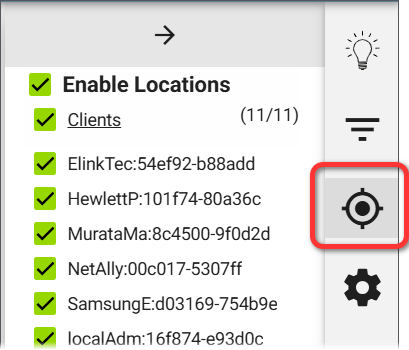
Drag device icons on the map to adjust their positions if needed.
Heatmap Settings
Click Settings in the right-side menu to control display options for the survey map:
-
Beacon points: Show or hide beacon measurement points on the map.
-
Values: Show or hide data values on the map.
-
Heatmap: Show or hide the heatmap overlay.
-
Comments: Show or hide comment annotations.
-
Grayscale FP: Display the floor plan in grayscale.
-
Rotate: Rotate the floor plan orientation.
-
Scale: Adjust the size of the circle drawn for each survey point on the map.
Views, Templates, and Reports
AirMapper Surveys support Views and Templates for saving and reusing display configurations, and can generate reports. See Views and Templates and Reports for details.