In our first blog and video we discussed that a large part of successful packet analysis lies in capturing packets in the correct spot and the best techniques to do so.
After you capture your packets, the next task is analyzing the trace file efficiently. With the packet capture tools available today it is common to have trace files that are well over 1 GB even if you use the tips suggested in the previous article.
Much like any project, the key is to ensure you have a plan and prepare accordingly.
Establish A Clear and Concise Goal
Like any project, ‘scope creep’ is real and can happen slowly but pervasively. If you were not the person capturing the packets, ensure that you know why the analyst captured the packets before starting any analysis. If they don’t have a clear or concise reason, chat with them to reach a common understanding. Was it a problem that prompted the capture? What symptoms were reported? If not a specific problem, what learning or insight is expected from the analysis? Knowing the goal is essential to efficient and thorough analysis.
Here’s how I typically categorize the reasons, goals, or objectives:
Discovery – Proactive Analysis
This could include analysis of any element of network communications, including bootup, login, application baselining, VLAN/subnet broadcast analysis or configuration validation.
Troubleshooting – Reactive Analysis
Even though this might sound obvious, establishing a clear objective when troubleshooting is harder than you would think. For example, “it is slow” is not a goal – that’s a symptom. Try to narrow things down by being specific. “Accounting application is running slow, and we have to prove if it’s the SQL server; if not, find the root cause” is much better. If you prove it’s not the SQL server, then you can focus on the web server, or other possible cause. But remember – make sure you thoroughly document whatever findings you discover.
Stay Organized
This encompasses various aspects of packet analysis such as:
Trace File Management
Having a standard file naming convention is incredibly helpful especially if you use a Ring Buffer configuration (whereby many separate trace files will be generated.) This also applies to folder names and file directory structures.
Use capture file comments (when available) in your favorite packet capture tool and ensure that the pcap or pcap-ng file formats are compatible with any other reporting or packet analysis tool you might have.
Troubleshooting Notes
Create a folder called ‘notes’ and put everything in there. Depending on how many files you have, you might create subfolders such as emails, photos, etc.
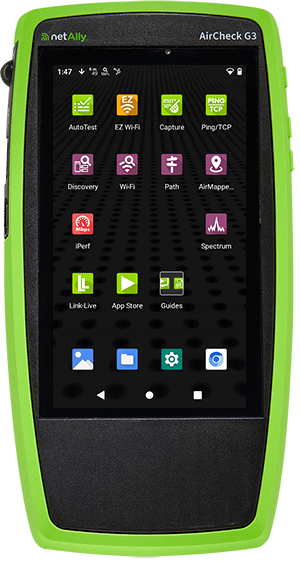
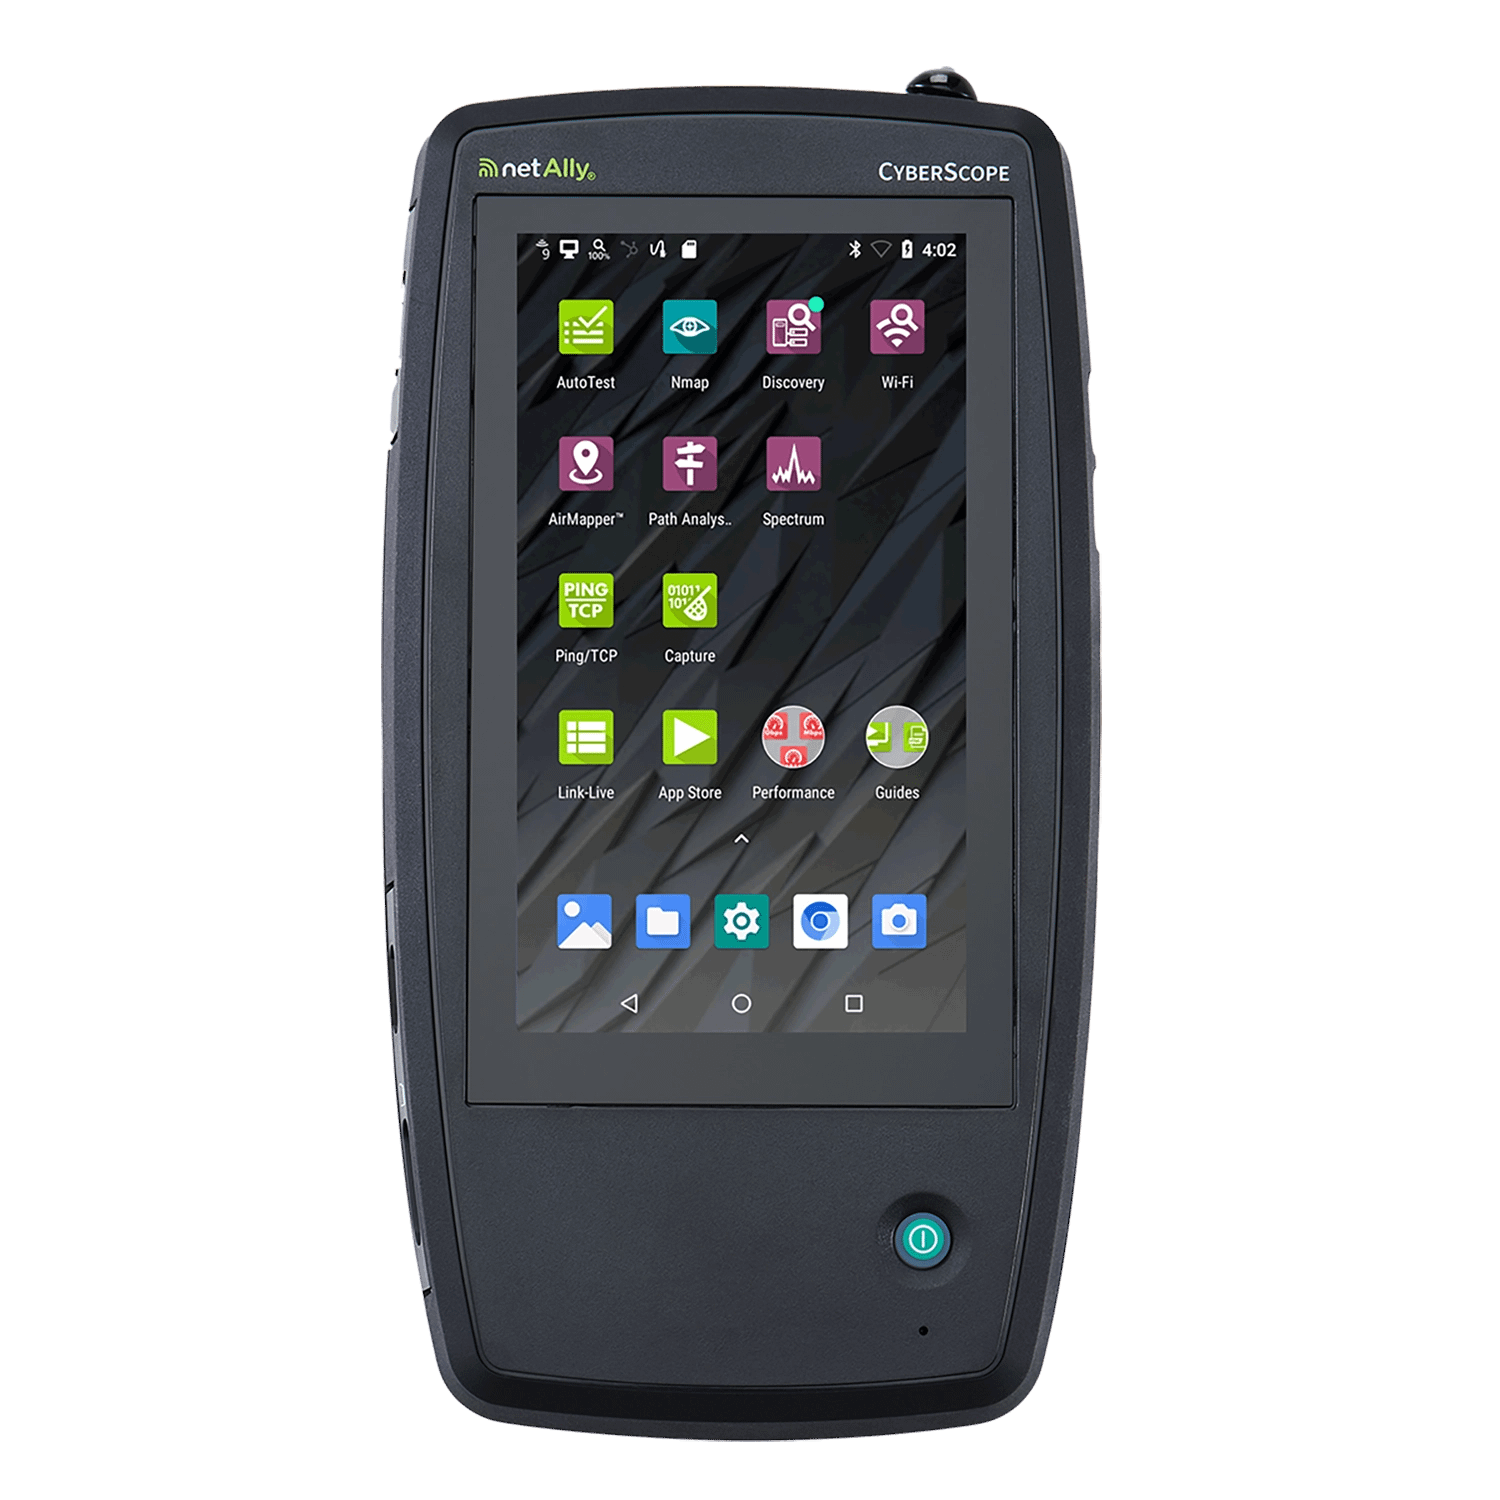
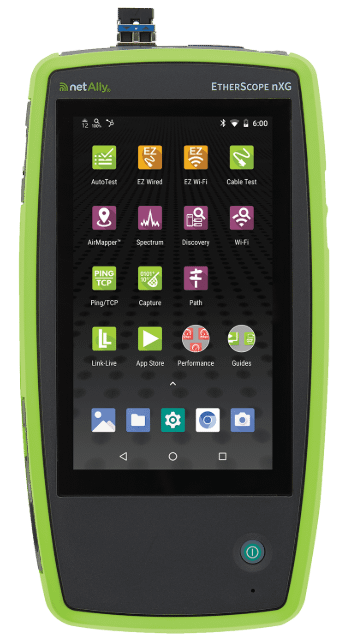
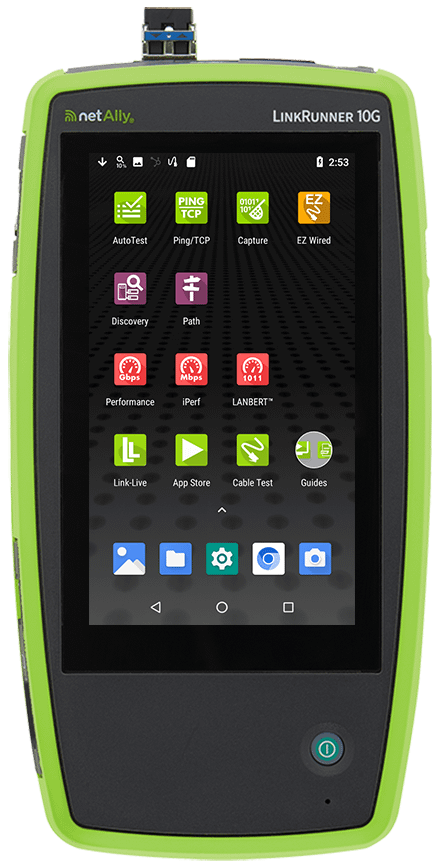
Then write up a description of your testing results or explain the findings to the client/team. It’s invaluable to have an up-to-date network topology diagram (such as the automated topology mapping provided by certain NetAlly tools and the Link-Live reporting platform.) Many times, teams will argue over how the network is configured versus how it’s behaving; having evidence of the current network configuration can save time.
Be Consistent
Try to establish a template or standard items to cover and report on. This ensures you don’t miss anything and is a great way to mentor or train junior staff. For example, you can have a template for VLAN broadcast analysis, bootup or login baselines. I have illustrated this in the video. A good example is to document if you excluded the tool’s MAC address, how long you did the capture, key findings, etc.
Dive In
Here are tips and tricks to help you go through your packets more effectively.
- Always start filtering at layer 2 to determine if IPV4 and IPV6 are being used and what the impact is.
- Confirm that there are
- Whenever you apply a display filter review the Wireshark endpoint and conversation reports.
- Get in the habit of documenting ‘application dependencies’ to better understand what can ‘slow down’ or interrupt the application’s operation.
- For applications that transfer a lot of data, ensure they are using as close to full-sized packets as possible for more efficient data transfer.
- For applications that are more latency-sensitive, look for packet loss or out-of-sequence packets.
- Use the delta time column and specific filters to determine the direction of high latency.
- When using TCP, make sure you get the TCP 3-way handshake and review the TCP options in use.
- Get familiar with the various features, reports and filters your favorite analyzer offers.
- Reach out for protocol analysis help or training to make your life easier.
Learn your product features
Every tool has its pros and cons. Make sure you figure out which tools help you the most in various scenarios. A great example are the basic display filters you can create within Wireshark.
In Wireshark, you have various ways to create display filters. Play around with them to understand which methods work best for you. If you discovered a cool filter, document it and/or save it for later use.