Introduction
Bluetooth is one of the most popular wireless technology communication technologies in the market. After all, it is used by most mobile devices to connect to peripherals like headsets, keyboards, mouses, and more. Still, with the introduction of Bluetooth Low Energy (BLE) v5.1 on January 2019 the technology also started to be used for real-time location services (RTLS).
RTLS solutions are normally used for tracking assets and people. For example, they could be used for locating equipment at a warehouse, medical devices in a hospital, or people in a supermarket.
In this blog we will explain how BLE location services work, how to use NetAlly’s handheld tools to validate BLE coverage, plus how to use Link-Live to analyze BLE site survey data and generate reports.
What is Bluetooth Low Energy?
Bluetooth Low Energy is a wireless network technology aimed at applications in healthcare, fitness, beacons, security, and home entertainment. Compared to classic Bluetooth, BLE is designed to use a lot less power while maintaining a similar communication range. Examples of common uses for BLE devices include:
- Tracking of medical equipment or patients in a hospital
- Connectivity between a smart phone and heart rate measurement sensors
- Detection and tracking of unauthorized BLE wireless devices
- Communication between home entertainment systems, remote controls, etc.
BLE is different from the older classic Bluetooth, but the two protocols can be supported by the same device. BLE uses the same 2.4 GHz radio frequencies as classic Bluetooth, allowing devices to use the same antenna for both technologies.
How do BLE Location Services Work?
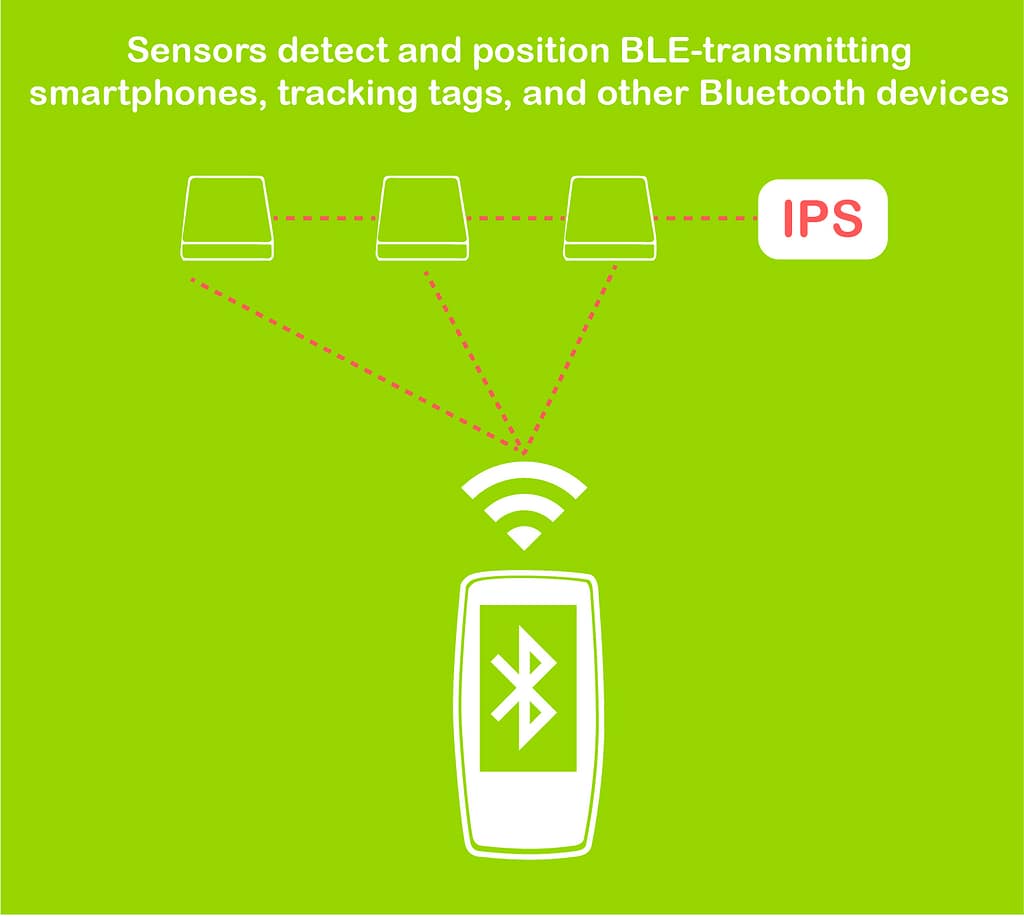
BLE location services use either sensors or beacons to detect and locate Bluetooth devices. Location data is then sent to applications used to determine the location of BLE devices.
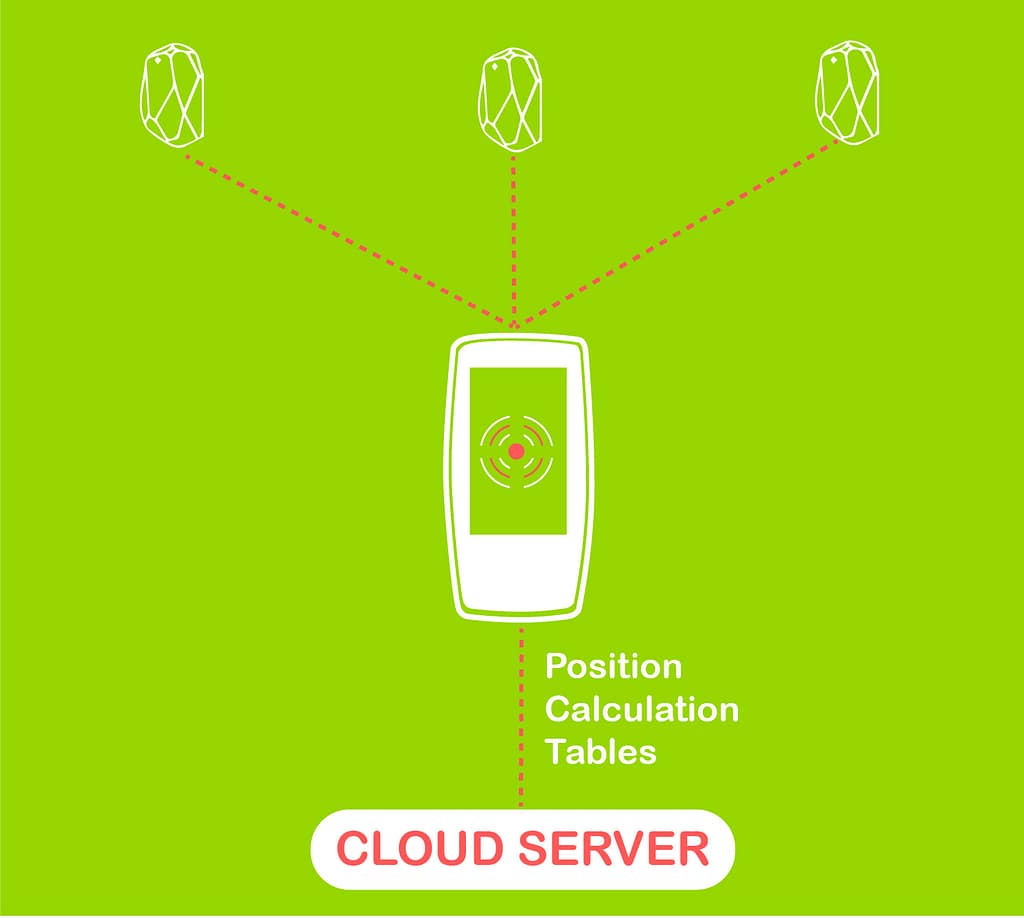
- Sensors – In this case sensors are deployed in fixed positions throughout a site. These sensors are then used to passively detect and locate transmissions from BLE devices based on their signal strength. This location data is then sent to a real-time location system that uses different algorithms to determine the location of BLE devices. That information can then be used to visualize the location of a device in a floor plan.
- Beacons – Beacons are installed in fixed positions and constantly transmit BLE signals that contain a unique identification code and other data, which can then be detected by devices in the area. The detection between one beacon and a device can then be used for location services that determine if a beacon and device are in range of each other. With multiple beacons strategically placed, communication between three or more beacons and a BLE device can be used to determine the location of the device.
How do I Perform a BLE Site Survey?
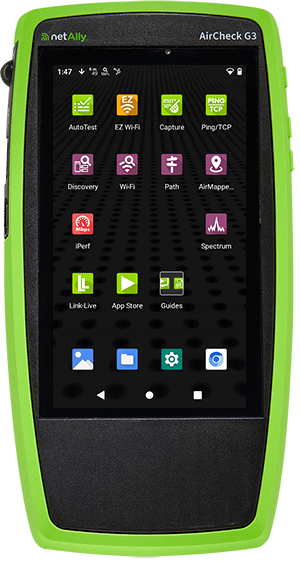
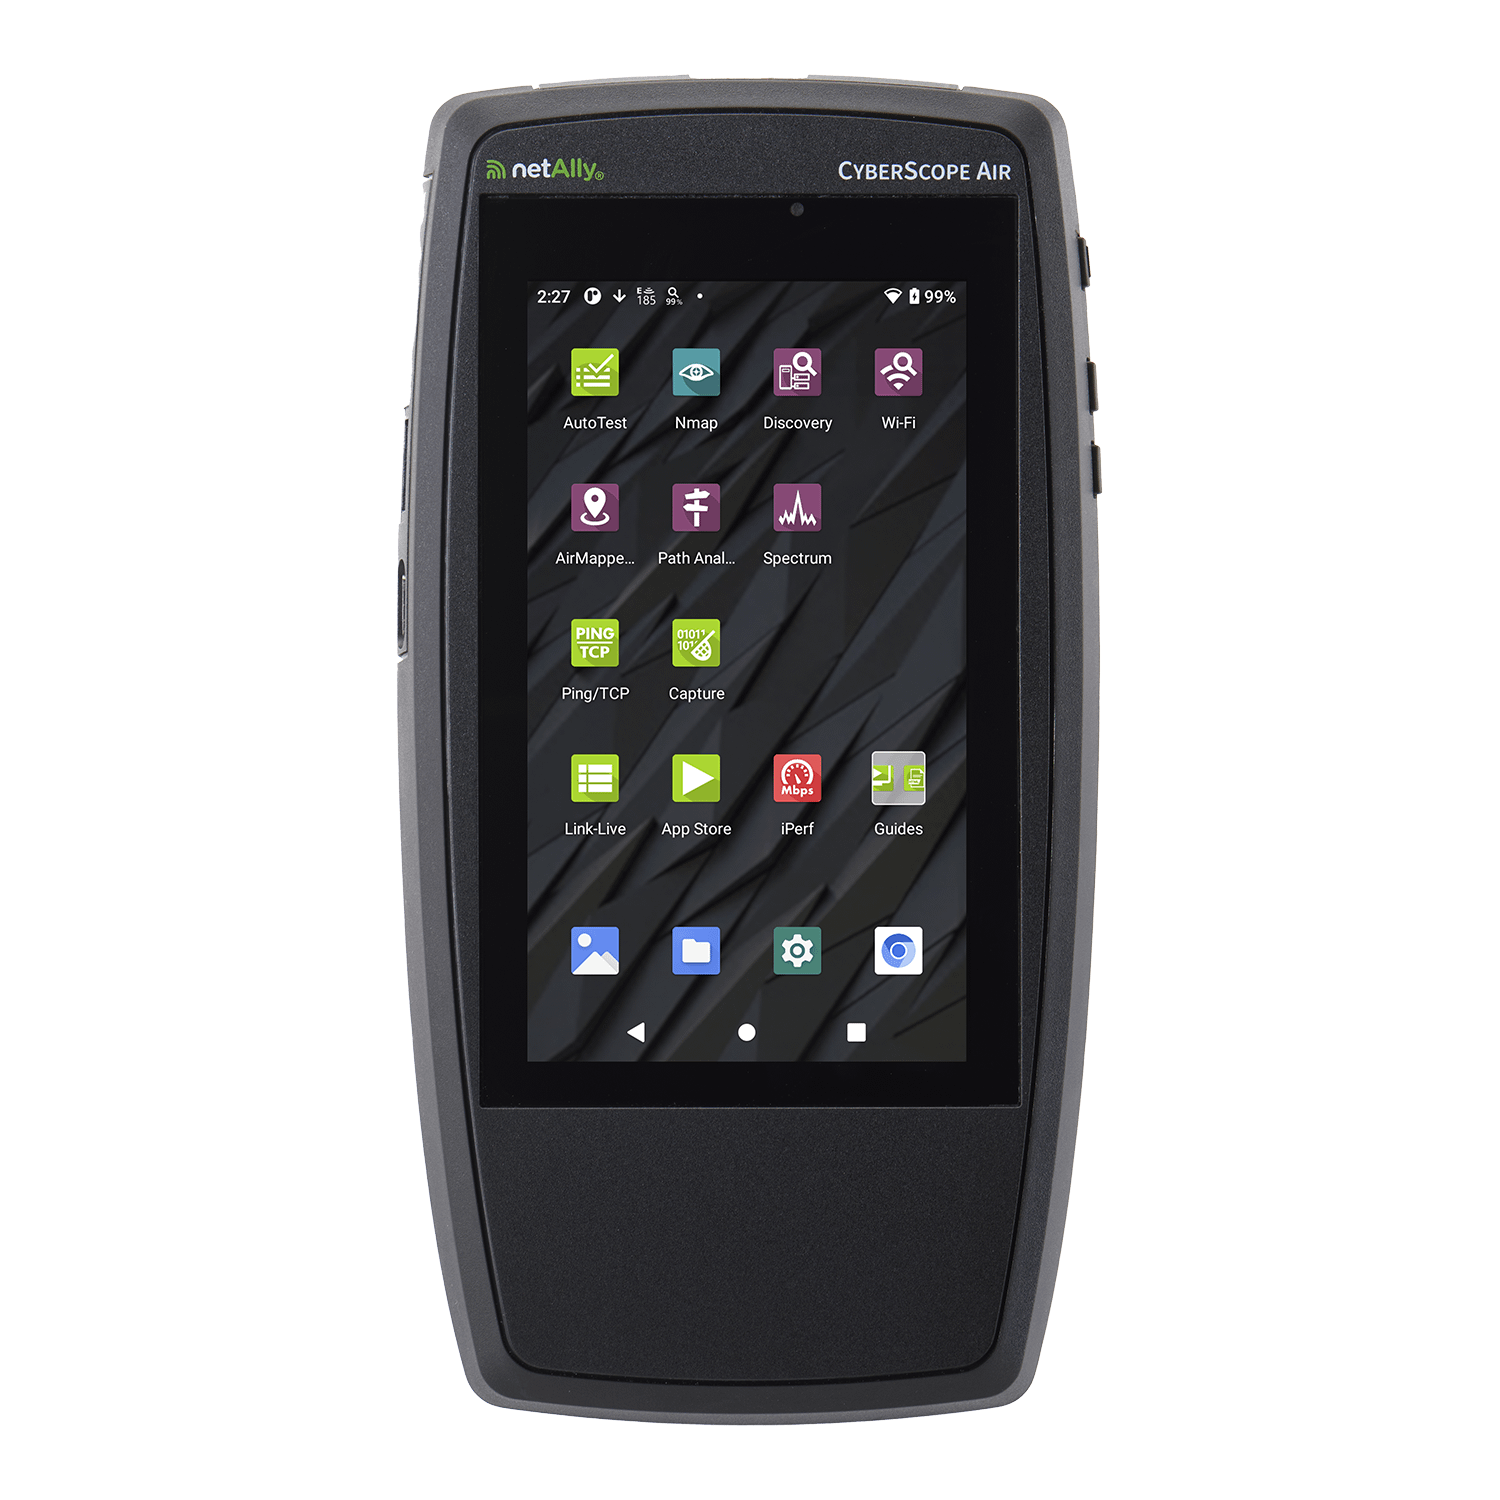
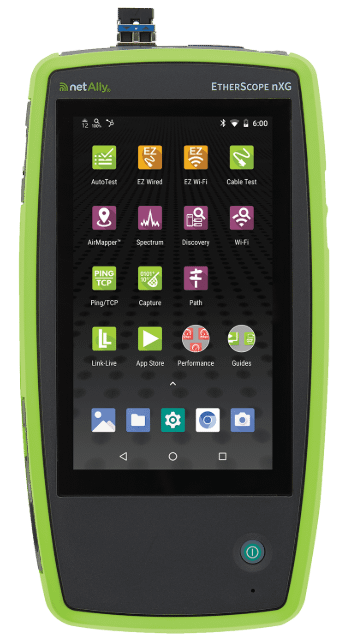
Performing a BLE site survey with NetAlly tools like an AirCheck G3, EtherScope nXG, or CyberScope is straight forward. Plus, it is a quick and simple way to help you validate BLE sensor or beacon coverage. Here is how it’s done!
- Turn on the Bluetooth radio in your NetAlly tool.
- Open the AirMapper app.
- Go to Settings and select the floor plan for the site on which you will be performing the site survey.
- Floor plans can be imported into your NetAlly test tool using Link-Live, a USB thumb drive, or your preferred file sharing app.
- Go back to the AirMapper home screen (where you can see the floor plan) and tap on the Start option.
For more details on how to perform a site survey check out our AirMapper Site Survey Best Practices application note or tutorial videos.
How do I Analyze BLE Site Survey Visualizations?
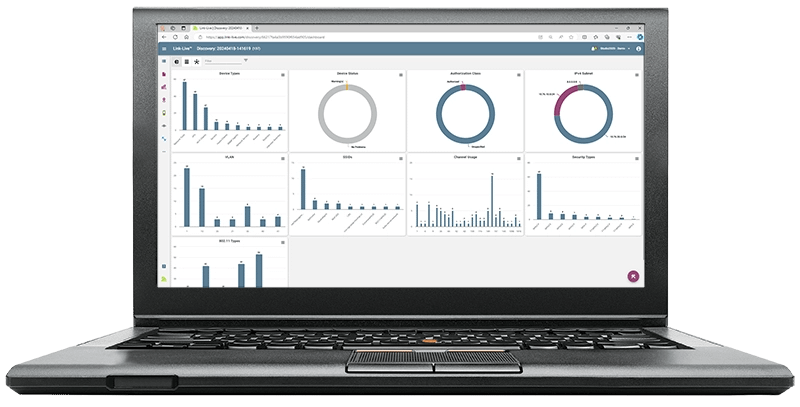
After you are done collecting the BLE site survey data you will need to upload your test results to Link-Liveto generate the visualizations or heatmaps. Here is how it’s done:
- After login into Link-Live select the AirMapper option on the left side of the screen.

- If you don’t have a Link-Live account check out this video to learn how to create one, plus how to claim your NetAlly tool.
- Select your site survey file from the list on the left side of the screen.
- Select the BLE Survey option on the upper right of the screen.
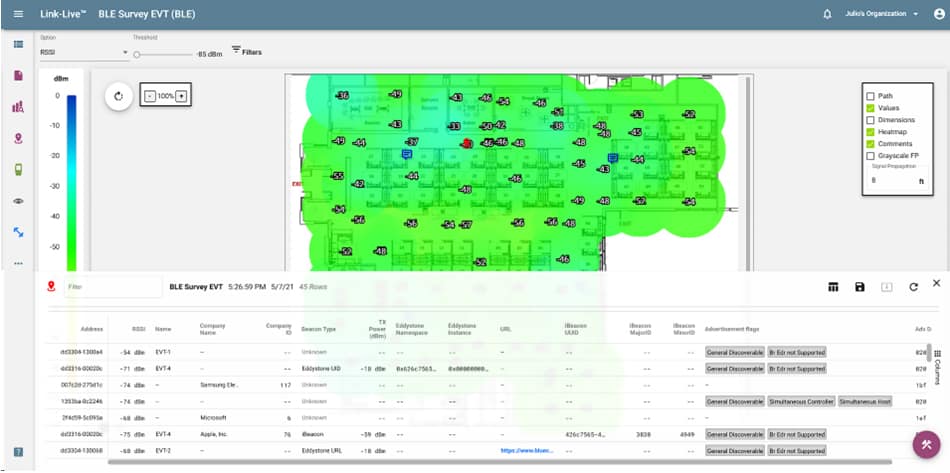
- After the site survey data loads you will be shown the RSSI visualization option (drop down on the upper left):
- RSSI – Refers to the signal strength as received by a BLE device. Bad signal coverage is still one of the most common reasons for BLE location service problems. After all, if BLE devices can’t hear a sensor or beacon you won’t be able to collect enough information to locate them.
- From here you will also be able to:
- Click on any data point on the floor plan to see more information about Bluetooth and BLE devices seen.
- Use the different tools available on the right side of the screen to hide or show Path, Values, Dimensions, etc.
- Apply different filters using the option provided on the upper left of the screen.
- Last, but not least, you can generate customizable reports using the tools available on the lower right of the screen.

For more details on how to analyze survey data collected with AirMapper or generate reports check out the following video.
Conclusion
BLE location services are an important part of your network and because of that ensuring that they are performing as expected shouldn’t be complicate or time consuming. AirMapper Site Survey provides a unique way of validating BLE network coverage by allowing you to generate visual heatmaps of network performance and showing you sensor or beacon configuration information.
Don’t get lost trying to solve BLE location service problems! Explore NetAlly’s range of wired and wireless testing solutions and start troubleshooting BLE and RTLS problems, today.