Introduction
NetAlly’s collaboration, reporting, and analytics platform, Link-Live, allows you to easily save and share test results with team members and customers, simplifies collaboration with cloud remote control, and it even lets you generate network topology maps or WiFi heatmaps. Still, did you know that it can also be used to quickly generate reports that can be used to prove the job was completed successfully?
In this blog we will show you how to generate customizable reports in Link-Live, create templates, and even how to share them with others. So, get your keyboards ready, it’s time to learn how to generate reports like a pro!
What is Link-Live?
Serving as a centralized site survey, test results, analysis and tester management system, Link-Live transforms team workflows with the ability to quickly and easily log, document, and report test activity from NetAlly handheld network testers and analyzers.
- AirCheck G3 Pro
- EtherScope nXG
- LinkRunner AT 3000
- LinkRunner AT 4000
- LinkRunner 10G
- CyberScope
- CyberScope Air
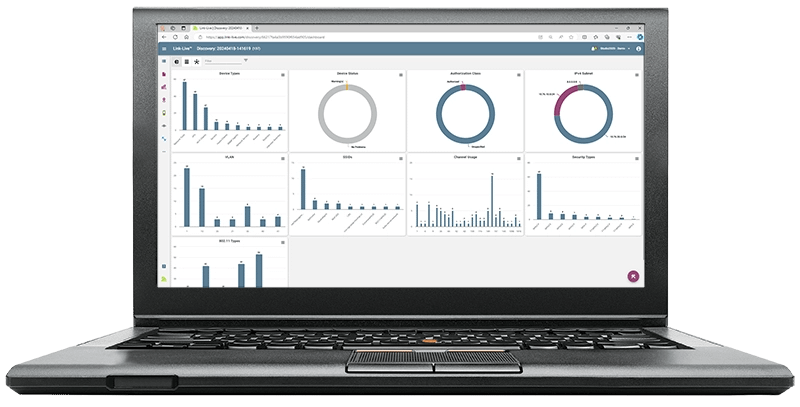
Once the instrument is connected to the Link-Live service, your test results, site surveys, and network discovery data are automatically uploaded to the dashboard for project management, analysis, mapping, collaboration and reporting. Plus, Link-Live gives you the option of uploading additional files, screenshots, images, profiles, packet captures, location information, and comments anytime.
Note: Link-Live is available as a free cloud service, but for organizations desiring a private installation or where public services are not allowed, Link-Live Private edition is a containerized, licensed subscription version for on-premises or private cloud deployment.
What types of reports are available in Link-Live?
You’re a person of multiple talents and because of that need the ability to generate different types of reports. Here is a list of the different types of reports Link-Live can help you create:
- Link-Live Test Results – Allows you to generate a report that includes test results collected while performing wired or wireless AutoTests. These reports can then be used to provide details about:n about all the devices found while running a discovery test. Discovery test results can be used to generate graphs, tables, and even topology maps. All of which can be included in your reports.
- WiFi network connectivity performance
- WiFi air quality (shows levels of utilization and interference)
- Copper and fiber network connections (link speeds, PoE, DHCP, DNS, VLAN, etc.
- AirMapper Site Survey Test Results – Allows you to generate WiFi or Bluetooth/BLE site survey reports, which include graphical representations of wireless network coverage and performance. This heatmaps can then be used to identify trouble spots on a site or prove that an installation was completed successfully.
How do I generate reports in Link-Live?
Generating different types of reports in Link-Live is simple. Here is how:
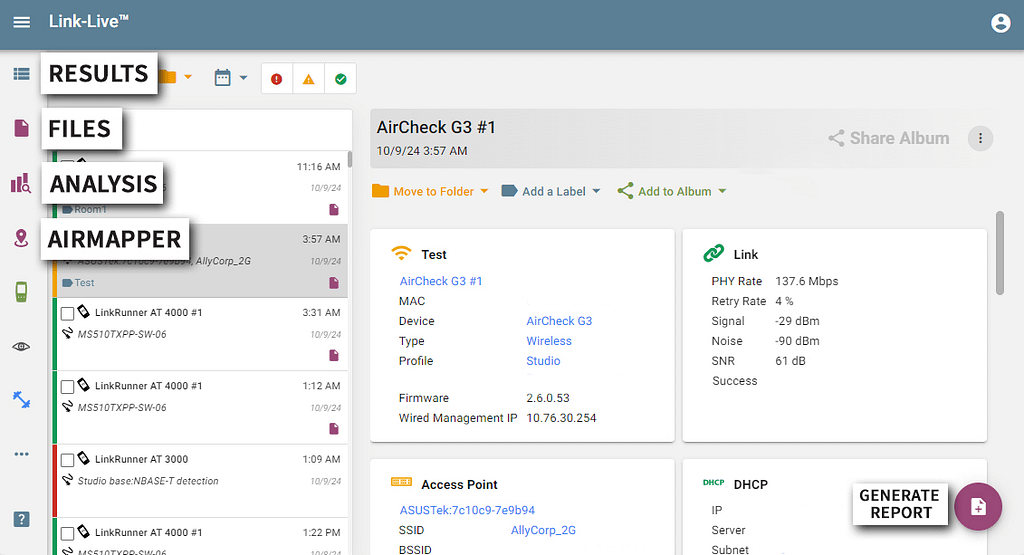
Link-Live Test Results
- Go to the Results section in Link-Live.
- Use the filtering options available on the upper left of the screen to select the test results you want to include in your report.
- Select the Generate Report option on the lower right of the screen.
- Select if you want to save your report as a CSV or PDF file.
- If you select the PDF option you will be given the option to include logos, images, or graphs in your report. You will also have option to change the report title, subtitle, or description.
- When done, select the Generate option.
Discovery Analysis Test Results
- Go to the Analysis section in Link-Live.
- Select the test results for which you want to generate a report. You will be able to generate reports for the following file types:
- Discovery
- Discovery Difference
- Path Analysis
- WiFi
- Select the Analysis option on the upper right of the screen.
- Use the option on the upper left of the screen to switch between Graph, Details, and Topology views.
- Select one of the Additional Actions options on the lower right of the screen.
- Create View – Allows you to save filters used.
- Browse Views – Allows you to select and reload saved Views.
- Generate Report – Allows you generate a PDF report. While creating a report you will be given the option to include a logo or use saved Views in your report. You will also have option to change the report title, subtitle, or description.
- Generate CSV – Allows you to generate a CSV report.
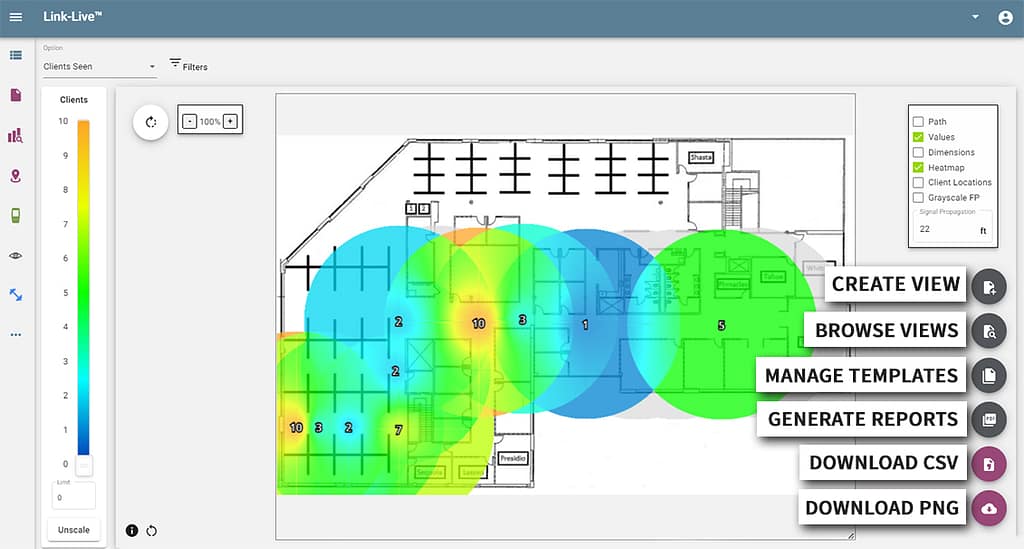
AirMapper Site Survey Test Results
- Go to the AirMapper section in Link-Live.
- Select the site survey project for which you want to generate a report.
- Select one of the survey visualization options available.
- WiFi Survey
- WiFi Client Survey
- BLE survey
- Select one of the Additional Actions options on the lower right of the screen.
- Create View – Allows you to save filters and visualizations used.
- Browse Views – Allows you to select and reload saved Views.
- Manage Templates – Allows you to create custom report templates and reuse them on other projects.
- Generate Report – Allows you generate a PDF report. While creating a report you will be given the option to include a logo or use saved Views or Templates in your report. You will also have option to change the report title, subtitle, or description.
- Download CSV – Allows you to save the site survey data into a CSV file.
- Download PNG – Allows you to save an image of the current site survey view as a PNG file.
How do I download Link-Live reports?
All reports will be automatically saved into the Files section of Link-Live. To download a copy of your report do as follows:
- Go to the Files section in Link-Live.
- Use the filter options available to find the report you want to download.
- After selecting the report click on the Export option to the upper right of the screen.
- Reports will be downloaded into your Downloads folder unless otherwise configured in your web browser.
- That’s it! You can now share your reports with coworkers or customers by using your preferred file sharing method (email, apps, etc.).
Conclusion
Generating professional looking network validation, topology mapping, or site survey reports doesn’t have to be complicated or time consuming. Link-Live removes the hassle of having to manually create reports by allowing you to put together custom views and templates that can be easily reused.
It’s time to raise your reporting prowess to over level 9000! Explore NetAlly’s range of wired and wireless testing solutions and start generating your own professional looking custom reports with Link-Live, today!
Click on the link below to watch our Link-Live™ Tutorial Series.