WiFi site survey visualizations… You’ve heard of them; you may have even seen someone walking around a site doing a survey or may have looked at one of those colorful heatmaps that are generated after a WiFi site survey has been completed. Still, what are WiFi site survey visualizations used for? At their most basic, they are used to generate a graphical representation of the WiFi network that allows you to visualize coverage, interference, noise, utilization, and other metrics. In simple terms, they allow you to see the invisible!
Whether you are conducting the survey before or after deployment, the same goal still applies – survey visualizations are used to understand the WiFi environment.
That being said, analyzing WiFi visualizations can be a time-consuming process that requires you to analyze different types of heatmaps and the metrics they represent. Not only that, just looking at heatmaps without knowing what information is important and what is not (or what is good or bad) could lead you to the wrong conclusions.
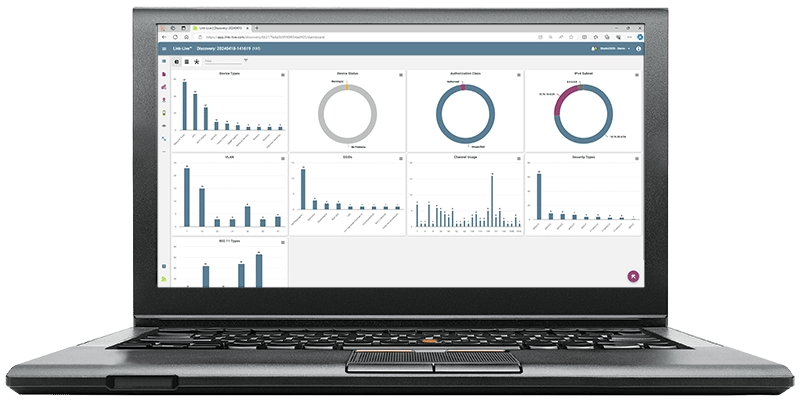
In this blog we will discuss how to analyze WiFi site survey visualizations the easy way using AirMapper™ in NetAlly’s Link-Live™ cloud service. Besides that, we will show you how to identify common WiFi network problems, plus provide tips on how to fix them.
Why is WiFi site survey visualization analysis important?
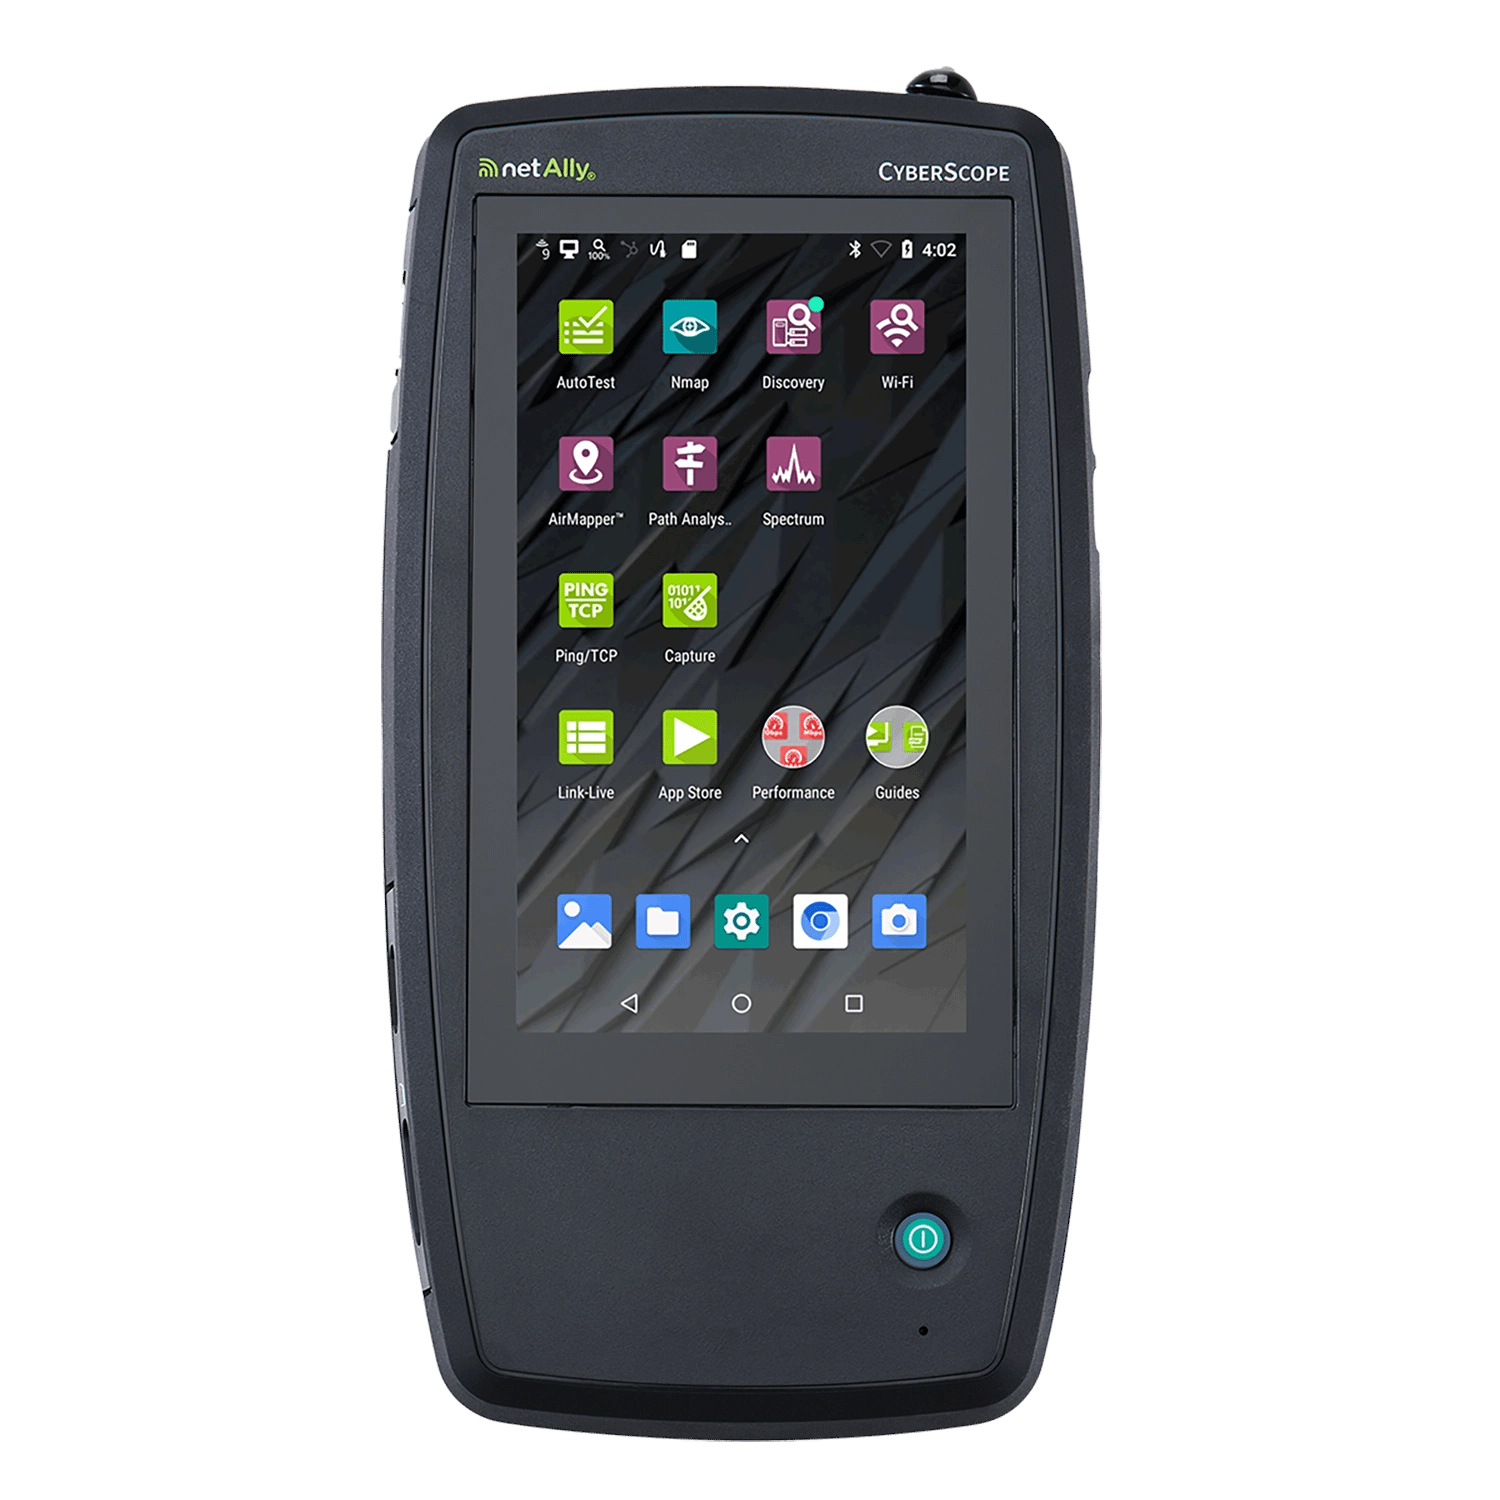
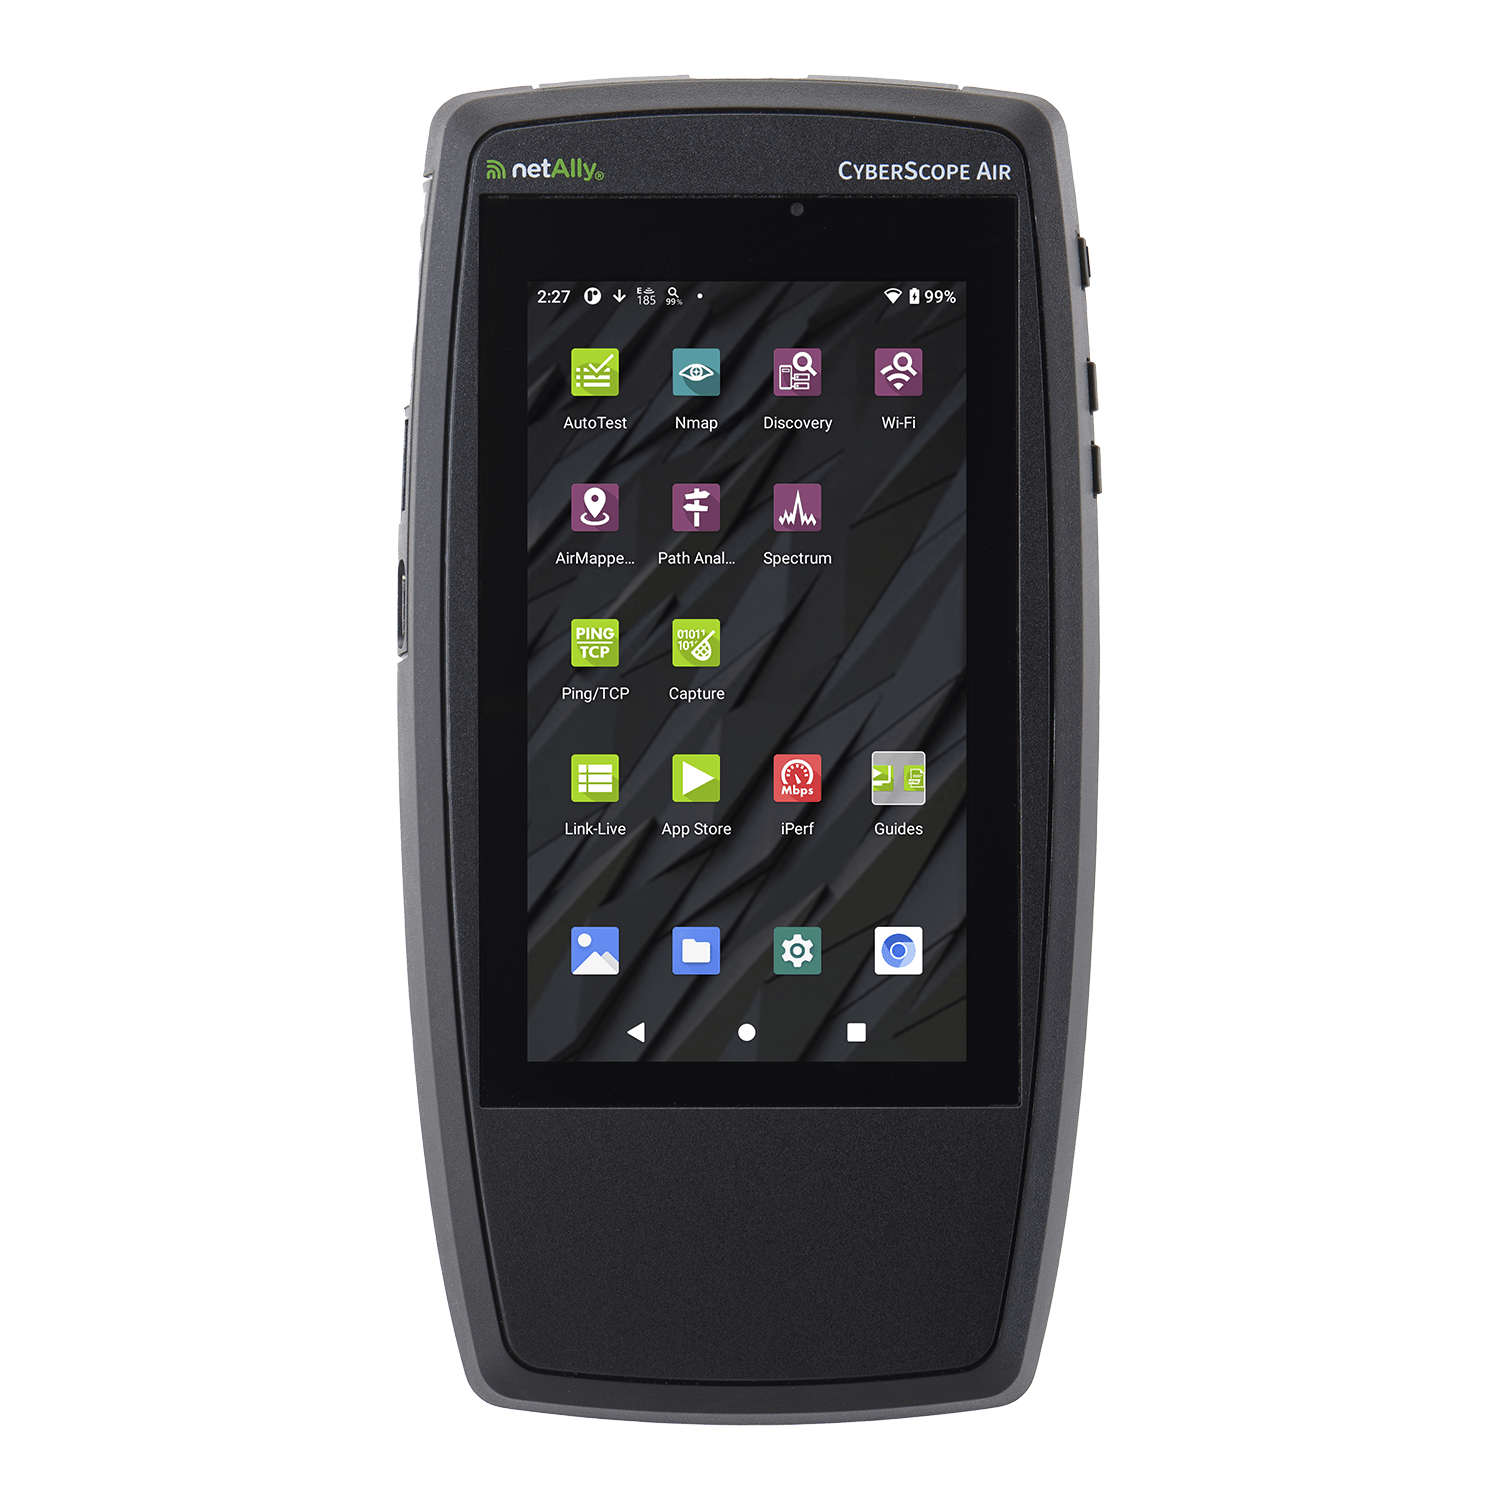
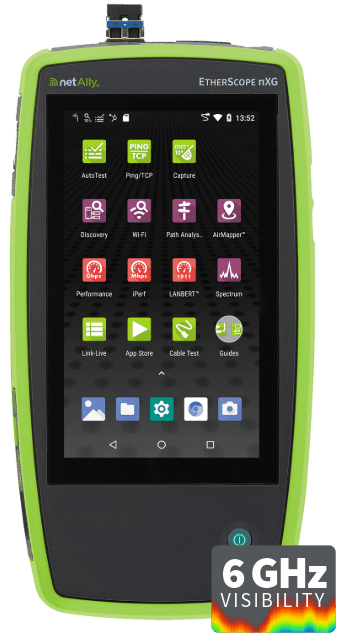
Performing a WiFi site survey with NetAlly tools like an AirCheck® G3, EtherScope® nXG, or CyberScope® is straight forward. Here is how it’s done!
Simply put, WiFi site survey visualization analysis allows you to proactively identify network problems before they impact end user productivity. After all, according to Gartner, IT outages cost businesses an average of $5,600 per minute (time is money as they say) and interruptions to critical applications can impact user productivity.
After all, WiFi is a location-based wireless communications technology, and because of that, WiFi performance can vary greatly from one place to another. Some of the main causes for performance differences between different locations are:
- Signal Attenuation: Differences in the RF environment caused by signals becoming weaker as they travel through open space, walls, furniture, people, cubicles, etc.
- RF Interference: Can be generated by neighboring networks and other interference sources (e.g. Microwave Ovens).
- High Utilization: Having too many devices accessing the network at the same time.
How do I perform a WiFi site survey?
Performing a WiFi site survey with NetAlly tools like an AirCheck G3, EtherScope nXG, or CyberScope is straight forward. Here is how it’s done!
- Open the AirMapper app available in your NetAlly tool.
- Go to Settings and select the floor plan for the site on which you will be performing the site survey.
- Floor plans can be imported into your NetAlly test tool using Link-Live, a USB thumb drive, or your preferred file sharing app.
- Select one of the Survey Modes available:
- Passive Surveys:
- Auto Sampling – Is the preferred way to perform a survey and it is often considered the easier of the methods because less tapping. When performing an Auto Sampling survey, you only need to tap when you change walking directions. All sampled data that’s collected between the last tap and the current tap is then evenly distributed along a straight line between the two data points.
- Current Scan – It allows immediate data collection based on continuous scanning of the selected bands and channels, and the most recent frame seen from each AP.
- Scan Once – Each time a point is selected, all the AP information is cleared, and a single scan of the selected channels is acquired. This is an exact measurement but in congested environments beacons not seen during the scan are not included in that sample point.
- Passive Surveys:
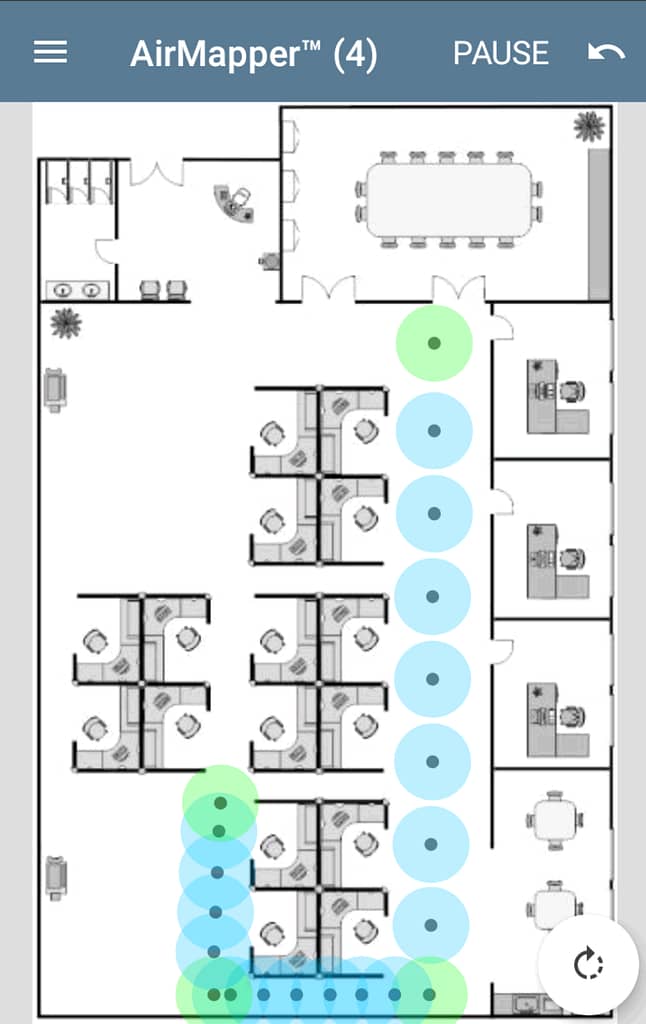
- Active Surveys:
- Connected – An active survey allows the user to map an existing deployment for network coverage and performance. While performing an active survey your NetAlly test tool will be connected to your WiFi network. Active surveys can also be used to validate that you can seamlessly transition (roam) from one AP to another without getting disconnected while you walk around a site.
- Use the WiFi Bands and Channels options to select the channels you want to scan.
- You also have the option of changing the Dwell Time. This is used to specify for how long you want to scan each channel. Still, note that the option to change Bands, Channels, and Dwell time is not available while performing an Active survey.
- Go back to the AirMapper home screen (where you can see the floor plan) and tap on the Start option.
For more details on how to perform a site survey check out our AirMapper Site Survey Best Practices application note or tutorial videos.
Pro-Tip: Want to know more about roaming? Click here to check out our WiFi roaming troubleshooting guide!
How do I analyze WiFi Site Survey visualizations?
After you are done collecting the WiFi site survey data you will need to upload your test results to Link-Live to generate the visualizations or heatmaps. Here is how it’s done:
- After login into Link-Live select the AirMapper option on the left side of the screen.

- If you don’t have a Link-Live account check out this video to learn how to create one, plus how to claim your NetAlly tool.
- Select your site survey file from the list on the left side of the screen.
- Select the Wi-Fi Survey option on the upper right of the screen.
- After the site survey data loads you will be given multiple visualization options (drop down on the upper left):
- Signal – Refers to the signal strength as received by a WiFi device. Bad signal coverage is still one of the most common reasons for Wi-Fi connection problems. After all, if Wi-Fi devices cannot hear each other then they cannot communicate.
- Noise – Refers to ambient energy on a specific WiFi channel. This background energy can include signals from nearby WiFi devices or energy coming from non-WiFi devices such as microwave ovens, Bluetooth headsets, cordless phones, and so on.
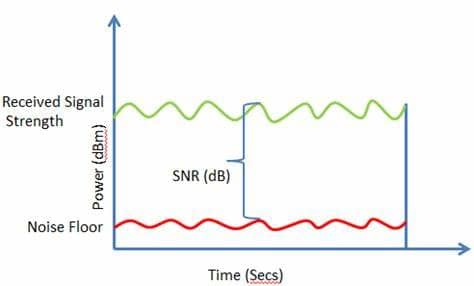
- SNR – Compares the level of the Wi-Fi signal to the level of background noise. The quality and rate of a connection depends directly on the signal-to-noise ratio (SNR) that a receiving device detects. A ratio of 10-15 dB is the accepted minimum to establish an unreliable connection; 16- 24 dB is usually considered poor. Meanwhile, 25-40 dB is good and a ratio of 41 dB or higher is considered excellent.
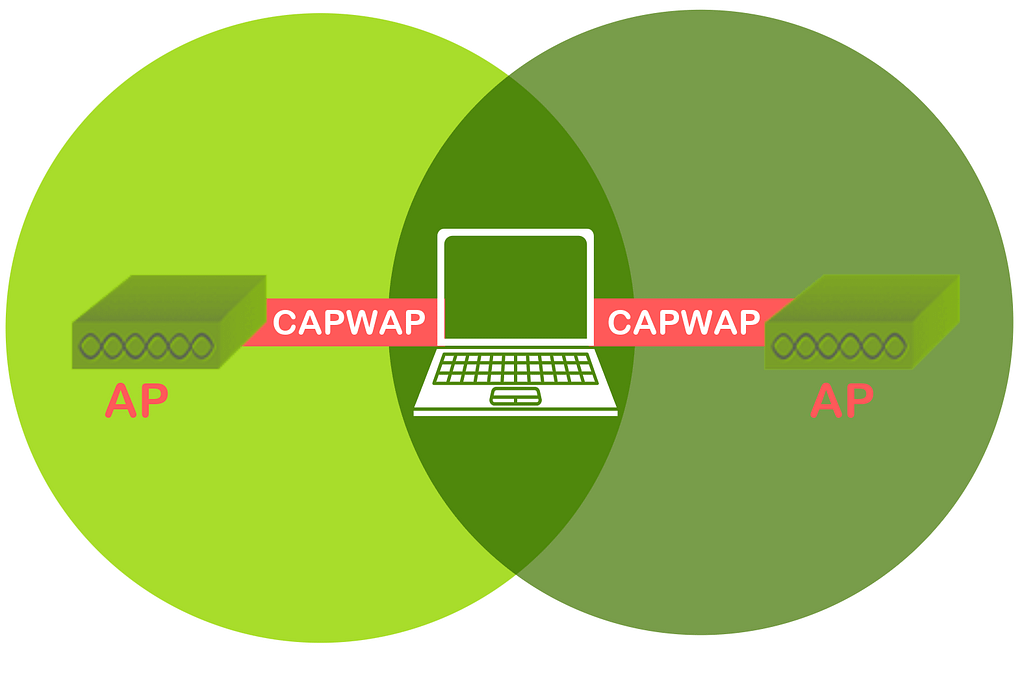
- Co-Channel Interference – One of the most common reasons for Wi-Fi performance problems is Co-Channel Interference (CCI), which is what happens when you have too many APs covering the same area while working on the same channel. This condition results in every client device and AP in that area having to wait in line before they can send a message since Wi-Fi is by nature a half-duplex type of communication (only one device can talk at a time).
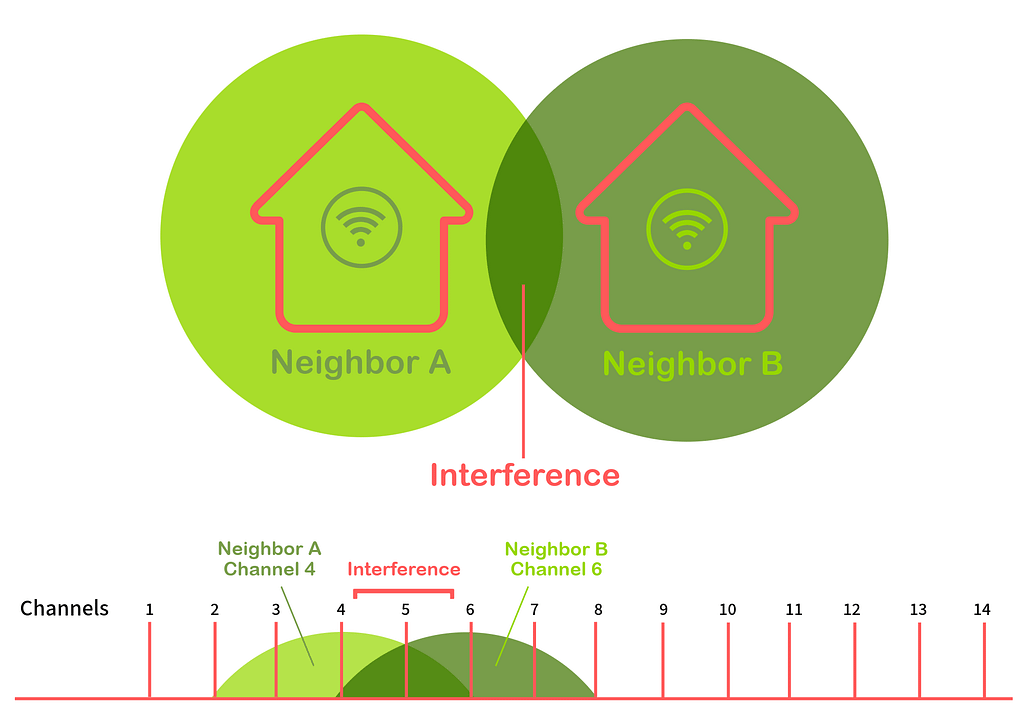
- Adjacent Channel Interference – Another common reason for Wi-Fi performance problems is Adjacent Channel Interference (ACI), which is what happens when you have too many APs covering the same area while using overlapping channels. In the past this condition could only happen on the 2.4GHz band, but when bigger channel widths were introduced ACI also became a problem on both the 5.0GHz and 6.0GHz bands.
- AP Coverage – It’s used to determine how many APs are covering each part of a floor plan. This information is very useful when you want to make sure a second or third AP are available as backups.
- Min Basic Rate – Are used to determine at what speeds (rates) Beacon frames will be transmitted. Beacon frames are used to tell client devices about Wi-Fi networks available and are transmitted at the slowest speeds to make it easier for end user devices to see them. To prevent performance problems on enterprise networks it is recommended you only use 12, 18, 24, 36, 48, 54 Mbps Min Basic Rates.
- Beacon Overhead – Refers to the amount (percentage) of traffic in a Wi-Fi channel used by Beacon frames. Beacon frames are used to tell client devices about Wi-Fi networks available and are transmitted at the slowest speeds to make it easier for end user devices to see them. Because of that, when you have a lot of beacon frame traffic, network performance can be impacted. Not only that, but the more Beacon frame traffic you have in a channel, the less space you will have available in that channel for data. For the best performance, it is recommended for Beacon Overhead to be less than 15% per Wi-Fi channel being used.
- Max TX/RX Rates – Refers to the max upload and download speed at which data could be transferred over a communications channel. Data rates do not take into consideration data encoding, modulation, encryption, noise levels, interference, and other factors, but can be used to determine the overall performance of the network. The actual throughput (network speed) is normally 60-70 percent of the supported Max Rates.
- Max TX/RX MCS – Are used to show the maximum transmit or receive modulation and coding scheme (MCS) value supported by the selected network. In combination with Channel Width and Guard Intervals, MCS values are used to determine the maximum Data Rates the network can achieve.
- Active 1 x1 Signal – Refers to the signal strength of the network you connected to while performing the survey. Bad signal coverage is still one of the most common reasons for Wi-Fi connection problems. After all, if Wi-Fi devices cannot hear each other then they cannot communicate.
- Active 1×1 TX Rate – Refers to the max transmit speed at which data could be transferred over the network you connected to while performing the survey. Data rates do not take into consideration data encoding, modulation, encryption, noise levels, interference, and other factors, but can be used to determine the overall upload speed performance of the network.
- From here you will also be able to:
- Click on any data point on the floor plan to see more information about APs seen.
- Use the different tools available on the right side of the screen to hide or show Path, Values, Dimensions, etc.
- Apply different filters using the option provided on the upper left of the screen.
- Last, but not least, you can generate customizable reports using the tools available on the lower right of the screen.

For more details on how to analyze survey data collected with AirMapper or generate reports check out the following video.
Analyzing Site Survey data, the easy way
Yes, analyzing all the visualizations mentioned above to try and identify the root cause of common WiFi problems can be a daunting task. Still, there is no need to panic, there is an easy way!
The Insites engine in Link-Live simplifies the process of identifying common Wi-Fi network problems and their root cause by comparing the site survey data collected with AirMapper to a set of predefined Limits (thresholds) based on industry best practices and providing a quick Pass or Fail.
- Here is how it works:
- After login into Link-Live select the AirMapper option on the left side of the screen.
- Select your site survey file from the list on the left side of the screen.
- Select the Wi-Fi Survey option on the upper right of the screen.
- Use the Filter options provided to select your network.
- Select the InSites engine option on the right side of the screen (it looks like a light bulb).
- Use the Run InSites option to start the automated analysis.
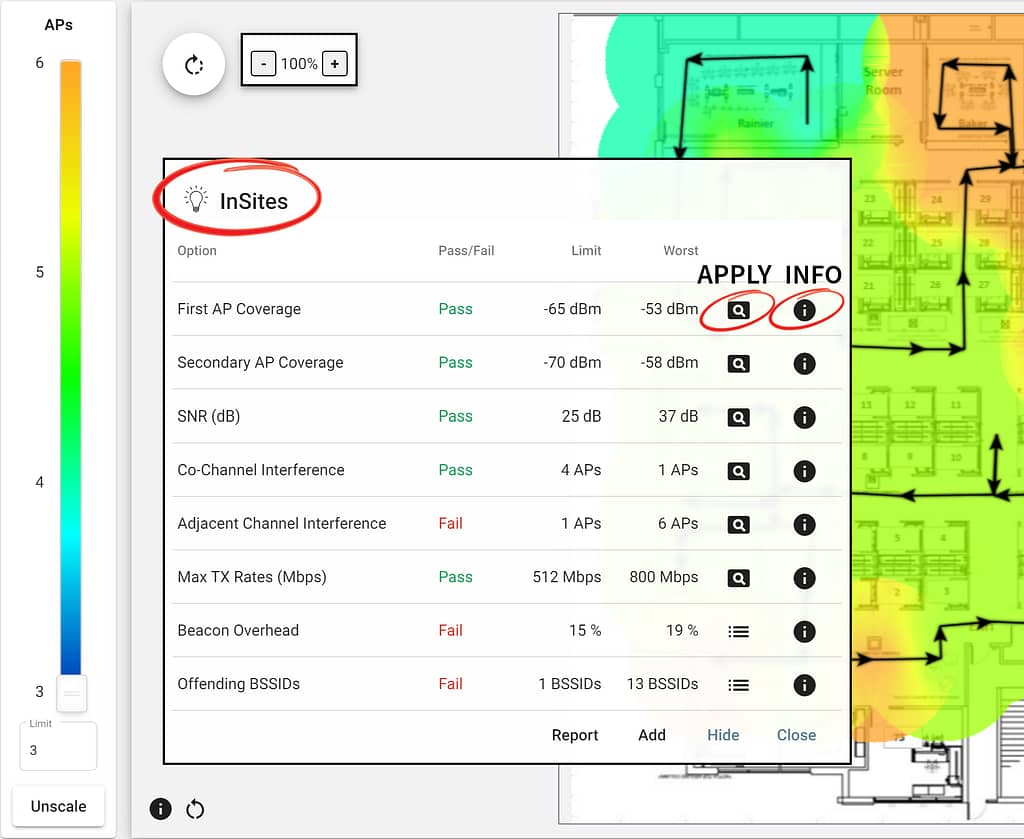
That’s it! Now, you just need to go through the list of common problems and find the tests that failed.
- If you want more information about the problem and guidance on how to fix it, select the Info option.
- If you want to know which areas of the floor plan or site are impacted by the problem that was identified, use the Apply option.
For more details on how to use the InSites engine to analyze survey data collected with AirMapper or generate reports check out the following video.

Common WiFi problems and how to fix them
The InSites engine can help simplify the process of both identifying and fixing the root cause of common WiFi problems. Here are some of common WiFi problems the InSites engine can detect automatically:
- First AP Coverage – Signal strength visualizations show WiFi coverage of the surveyed area. Signal coverage is measured in units of “dBm”, with a signal of 0 dBm being the strongest, and signals of -100 dBm and below being the weakest. A minimum signal strength of -65 dBm throughout the site is recommended.
- To solve signal coverage problems, you could increase the transmit power of existing APs or install new access points.
- Secondary AP Coverage – As a best practice on enterprise networks you should always have a second AP (or even third) covering the same areas as other APs. This is done for backup purposes. If one AP fails, instead of losing connectivity, client devices will have the option to connect to a secondary AP. For secondary APs, a minimum signal strength of -70 dBm throughout the site is recommended.
- To solve secondary AP signal coverage problems, you could increase the transmit power of existing APs or install new access points.
- SNR – Signal to Noise Ratio (SNR) is a measurement of how strong a WiFi signal is when compared to noise levels in the area. SNR with higher values equate to faster data rates, fewer retransmissions and overall better throughput. For the best network performance, a minimum SNR of 25 dBm is recommended.
- The SNR can be improved by mitigating sources of noise or increasing signal strength.
- Co-Channel Interference (CCI) – The most common source of interference is co-channel interference, which is caused by wireless access points that are operating on the same center channel. It’s like having too many people trying to chat in the same crowded room. If everyone talks at the same time, it’s more difficult to understand each other and you may have to repeat what you said multiple times. For the best performance, on the 2.4 GHz band you should have less than 4 APs per area using the same channel. Meanwhile, on the 5 GHz and 6 GHz bands there should be less than 2 APs on the same channel (as there are more channels available).
- To resolve co-channel interference problems, you just need to make sure that each of your APs is configured to use a different channel. Using the radio resource management (RRM) option on your APs can simplify this process.
- Adjacent Channel Interference (ACI) – Is caused by WiFi APs that are operating on adjacent or partially overlapping channels. Imagine you’re at a restaurant sitting very close to another table. Even though you’re not part of the other table’s conversation, their voices can spill over and make it hard for you to hear your own table’s chat. ACI is similar – WiFi devices transmitting on nearby channels can interfere with each other, and it’s like noisy neighbors disrupting your quiet dinner. For the best performance, on the 2.4 GHz band it is recommended for you to only use 20 MHz channels widths and non-overlapping channels like 1, 6, and 11. Meanwhile, on the 5 GHz band you should limit channel widths to 20 MHz or 40 MHz, and on the 6 GHz band you should limit channel widths to 40 MHz and 80 MHz (if all of the 59 channels are available in your country).
- To resolve adjacent channel interference problems, you just need to make sure that each of your APs is configured to use non-overlapping channels. Using the radio resource management (RRM) option on your APs can simplify this process.
- Max TX Rates – Refers to the max upload speed at which data could be transferred over a communications channel. Data rates do not take into consideration data encoding, modulation, encryption, noise levels, interference, and other factors, but can be used to determine the overall performance of the network. Recommended Max TX rates will depend on the application (emails, large file downloads, video streaming, voice calls, etc.). Still, 500 Mbps should be more than enough for most applications.
- To resolve problems with low Max TX Rates, validate that your AP is configured to support these higher speeds (using max MCS) and make sure to have an SNR higher than 25 dBm.
- Beacon Overhead – Refers to the amount (percentage) of traffic in a Wi-Fi channel used by Beacon frames. Beacon frames are used to tell client devices about Wi-Fi networks available and are transmitted at the slowest speeds to make it easier for end user devices to see them. For the best performance, it is recommended for Beacon Overhead to be less than 15% per Wi-Fi channel being used.
- You can limit the number of Beacon frames being transmitted by lowering the number of SSIDs being used by AP. Best practice is to use 2 SSIDs or less per WiFi band.
- Offending BSSIDs – Identifies BSSIDs that violate the Limits set. BSSID limit violations include channel overlap and widths, channel changes, weak security configurations, low minimum basic rates, or the use of DFS channels in the 5 GHz band.
For more details on the different types of Limits available for Offending BSSIDs check out the following video.
Conclusion
Analyzing WiFi site survey visualizations doesn’t have to be a difficult and time-consuming process. The InSites engine in Link-Live simplifies the process of identifying the root cause of common WiFi problems by automating the analysis process. Plus, provides guidance on how to resolve the issues. Helping you prevent interruptions to critical applications that can impact user productivity (making you the hero of the day!).


