This is the third blog in a series on WiFi 6 and the new 6GHz spectrum. Read the other blogs as well:
Wireless networks have always been considered a mysterious black art in design, validation, and troubleshooting because there is no visible physical connection. Over the years, various tools have tried to demystify wireless technology and provide visibility into the spectrum. Most likely, you have sat through the various training courses and discussed best practices for surveying and collecting data. Today, we will discuss how this all changes with WiFi 6/6E and the new 1200MHz worth of spectrum we potentially gain, depending on your geographical location.
Main methodologies of performing wireless validation surveys
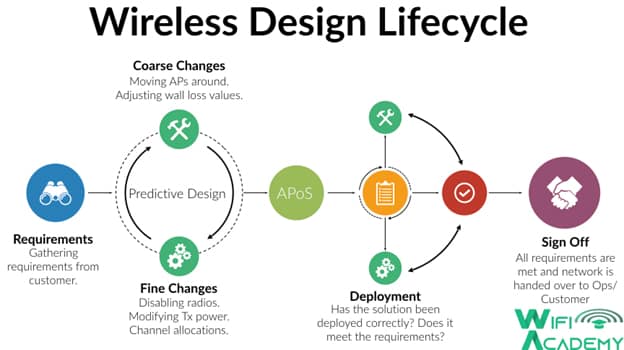
I’ve used this slide in many training courses and presentations as it outlines the process we try to follow when designing a new wireless network. In this blog the workflow we will discuss is the Deployment stage where we perform wireless validation surveys. When performing this data collection process, there are usually two main methods: continuous or stop-and-go.
As the name implies, continuous means constantly collecting data while walking a location and clicking on the map to represent where you were when the application recorded the data. Stop-and-go requires walking to a place, tapping on a floor plan, and recording data. Any data in-between your stop-and-go locations will be discarded and typically considered inefficient and potentially less accurate.
The challenge with a continuous-based data collection method.
When leveraging continuous data collection methodologies, it is easy to get a false sense of confidence in the data. Visualized data is only as accurate as the information collected. In this article, we will not focus on the human element of collecting the data but on the behind-scenes automated process.
First, let’s start with 2.4GHz networks that have a total of 11 channels (if you need a refresher on channels, please see https://www.netally.com/wi-fi-6/wifi-6-designing-for-6ghz-channels/) and how we collect data for analysis. We need to capture a beacon for a tool to visualize data from a network. An access point (AP) will send this beacon approximately every 102.4 milliseconds. To capture that beacon, we need to listen to the channel the AP is configured to operate in. However, we can’t just listen for only 102.4 milliseconds as we don’t know where the AP is in the countdown, nor do we know if the AP will always be on time, as it might be busy serving data connections and delay a beacon. Because of this, most analysis applications listen for a minimum of 150 milliseconds per channel.
Additionally, to get the most accurate network view, we can’t just collect data on the non-overlapping channels of 1, 6, and 11. We need to capture ALL channels as this will enable us to accurately see Adjacent Channel Interference (ACI) and Co-Channel Interference (CCI). At 150 milliseconds per channel, all 11 channels will take 1.65 seconds to monitor. While this might not seem like a lot, let’s add the 25 5GHz channels to our scan list. Now our scan time increases by another 2.56 seconds. If we only have a single wireless adapter in our scan device, how much distance can you cover in 4.21 seconds? (At a reasonably slow pace, this could be a much as 5 meters (16 feet) difference!)
What happens with the continuous-based data collection process is that the data can be pushed away from where it was measured and be visualized in the wrong location.
Now add in 1200MHz worth of new spectrum with 6GHz giving us 59 channels. It will take six full seconds to complete if we want to scan all 59 channels! From a client perspective, various methods of in-band AP discovery mechanisms solve this problem. But from a validation and troubleshooting perspective, it remains. If we only scan the Primary Scanning Channels (PSC), we will still miss ACI. Using more radios will speed up the process but increase costs and data integrity concerns, and still doesn’t solve the overall problem of misleading data.
Why Stop-and-go tests are the solution
Since 802.11n with Multiple Input Multiple Output (MIMO) and beamforming technologies, beacons have become less reliable in determining coverage and connectivity due to their inability to be beamformed. With WiFi 6/6E validation and troubleshooting, a different approach makes more sense than what we are used to doing in the past. We need to focus less on essential “can you hear the network” and more on progressive “what can you do on the network” types of tests. For us to complete these more progressive tests, stop-and-go makes more sense. Wireless networks have become less about blanket validation of an entire floor and more about spot-checking-once reserved only for troubleshooting. Leveraging an efficient stop-and-go plan can be quicker and less prone to errors. Another benefit of stop-and-go is how easy it is to perform surveys, allowing more accessibility to critical or restricted areas such as hospital labor and delivery rooms. Nursing staff can be quickly trained on the process and enter rooms that would otherwise not be accessible for data collection.
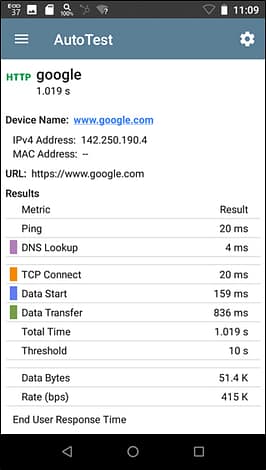
Beyond the error proneness of continuous sampling, now more than ever, it is more important to push data across the wireless connection and see how things like transmit beamforming and MIMO influence the strength of the link. We must actively associate with the network to do tests such as iPerf. We still want some passive data to understand ACI and CCI, but the primary focus should be on an active data connection.
Final Thoughts
Unless otherwise requested, lately, I have been performing more stop-and-go spot check style surveys and have considered my data to be more accurate than in the past, enabling me to determine the network’s health more quickly. Instead of the limited view provided by beacon data only across the entire facility, the comprehensive picture provided by actual data frames shows how the network functions at scale. In my experience, the time to complete a stop-and-go survey vs continuous of an area has roughly been the same. I’ve been able to more freely move around areas to ensure frictionless validation and troubleshooting while businesses continue to operate.

Author bio
Blake Krone is an independent Mobility Consultant and developer. His primary focus is providing solutions for the next generation of devices and business use cases for many Fortune 500 companies and startups. He has developed training materials and presentations through his experience deploying some of the largest single-site networks, sharing the knowledge and insights gained. When he isn’t designing and deploying networks, he builds data analysis tools and tests client devices and tools.
Related Resources